
Estimates of Technology Costs and Fuel Consumption Reduction Effectiveness
The committee’s estimates of fuel consumption reduction effectiveness and costs of the technologies discussed in previous chapters are examined from an application perspective in this chapter. The previous chapters identified current and future technologies that are effective for reducing fuel consumption. Although many of these technologies, such as engine friction reduction, are applicable to most vehicles, others are specific to particular classes of vehicles. Secondary axle disconnect, for example, would be applicable only to four-wheel-drive vehicles. Some of the technologies discussed in previous chapters have already been incorporated in current vehicles, and additional technologies are expected to be applied by the 2016 MY. Vehicle classes and baselines are discussed in this chapter followed by the central topics of fuel consumption reduction effectiveness and cost estimates of technologies and the implementation of the technologies in vehicles.
FUEL CONSUMPTION REDUCTION EFFECTIVENESS AND COST OF TECHNOLOGIES
Vehicle Classes
The National Highway Traffic Safety Administration (NHTSA) used twelve vehicle classes in its support documentation for the final CAFE rule: Subcompact Car, Compact Car, Midsize Car, and Large Car; performance versions of these four classes of cars; Small sport utility vehicle (SUV)/Pickup/Van, Midsize SUV/Pickup/Van, Large SUV/Pickup/Van, and Minivan. The NRC Phase 1 study considered ten vehicle classes, although these classes were consolidated into five classes for evaluating costs and effectiveness (NRC 2011). From this evaluation, the relative costs and effectiveness values were found to be primarily influenced by engine type, specified as I4, V6, or V8, rather than by vehicle type. Based on the results from the NRC Phase 1 study, the following three classifications of vehicles and associated engine types were selected to be appropriate for the analysis of overall costs and effectiveness for the current study:
- Midsize Car with I4 dual overhead camshaft (DOHC) engine,
- Large Car with V6 DOHC engine, and
- Large Light Truck with V8 overhead valve (OHV) engine.
The committee used these classifications in evaluating the Agencies’ estimates since comparability with the Agencies’ classifications was important. The Environmental Protection Agency (EPA)/NHTSA joint Technical Support Document (TSD) (EPA/NHTSA 2012a), which was used to provide baseline information in this section, uses classifications that are slightly different from those used by the NHTSA Regulatory Impact Analysis (RIA) (NHTSA 2012). Generally, the Compact/Midsize car classes of the RIA were aligned with the Midsize Car class used in the TSD. Likewise, the Large Car class in the RIA was aligned with the Standard/Large Car class used in the TSD. The Large Light Truck classification was consistent in the RIA and the TSD.
Baselines
The selection of a baseline is important in assessing the overall costs and effectiveness of technologies. EPA and NHTSA defined a null1 or baseline vehicle as consisting of the following features:
_____________
1 The null vehicle concept was developed by EPA and NHTSA as a reference point against which effectiveness and cost can be consistently measured (Olechiw 2014). It is defined as a vehicle having the lowest level of technology in the 2008 MY. Technologies are first added to bring the null vehicle into compliance with the 2016 standards, followed by compliance with the 2021 and 2025 standards. The concept is particularly important because, even though NHTSA and EPA use different compliance models, the effectiveness values determined by both Agencies are relative to the same null package; each compliance model uses the same base data. This committee applied the null vehicle concept to illustrate effectiveness and cost in an example pathway.
- Spark ignition (SI) engine,
- Naturally aspirated,
- Four valves per cylinder (except two valves per cylinder for OHV engines),
- Port fuel injection (PFI),
- Fixed valve timing and lift, and
- Four-speed automatic transmission.
Although the Agencies’ analysis began with the 2008 MY, very few vehicles in the 2008 MY had the limited content of this null vehicle. Many, however, contained some of the EPA and NHTSA technologies defined in the TSD. EPA’s and NHTSA’s analysis for the final rule began by identifying technologies in the 2008 MY vehicles that were in addition to those in the null vehicle. Although the Agencies correctly ascribe technologies already applied in their compliance models, a revised null vehicle and better discussion of the concept is appropriate for the mid-term review. In this chapter, the baseline for most of the initial technologies within a category is the baseline or null vehicle. The effectiveness and cost of the technologies that follow the initial technologies are specified as “relative to” one of the following: (1) the baseline or null vehicle, (2) the previously applied technology, or (3) another defined reference condition as discussed in a later section of this chapter.
Effectiveness of Technologies
Many of the technologies identified in previous chapters are broadly applicable across most light-duty vehicle classes, although some limitations must be considered. As discussed in Chapter 5, dual clutch transmissions (DCTs) may not be acceptable to customers for midsize and larger cars due to launch and gear shifting quality concerns that contrast with the smooth performance provided by a conventional automatic transmission with a hydraulic torque converter. Likewise, continuously variable transmissions (CVTs) have torque limitations that preclude applications requiring high torque loads in vehicles with larger engines, where towing is an important functional attribute.
Table 8A.1 provides a compilation of the committee’s low and high most likely estimates of fuel consumption reduction effectiveness for the technologies discussed in the previous chapters (see Table 8A.1). The derivations of the low and high most likely estimates, which are discussed in previous chapters, relied on (1) fundamental technical analyses, (2) literature reviews, including the Phase 1 NRC study, (3) full system simulation, (4) EPA certification test data, (5) inputs received from vehicle manufacturers and suppliers, (6) comparisons with extensive EPA and NHTSA evaluations using full system simulations, including the lumped parameter model, and (7) the committee’s expert opinion. For reference, EPA and NHTSA estimates of fuel consumption reductions, which are provided in the TSD (EPA/NHTSA 2012a), are shown in Appendix S, Table S.1.
The committee’s most likely estimates of fuel consumption reduction effectiveness are comparable to NHTSA’s estimates for many of the technologies defined by NHTSA. The committee estimated higher most likely effectiveness values for several technologies, including mass reduction (12.2 percent compared to NHTSA’s estimate of 10.2 percent for a 20 percent mass reduction) and high-efficiency gearbox technology (4.9 to 5.4 percent compared to NHTSA’s estimate of 2.7 percent when applied to an eight-speed automatic transmission, although NHTSA’s eight speed transmission is assumed to include some benefits of efficiency improvements not included in the 2.7 percent improvement). For some other technologies, including several of the turbocharged, downsized engine technologies and P2 hybrids, the committee extended the range of most likely estimates of effectiveness to include lower values. For several other technologies, including shift optimization (0.5 to 1.0 percent compared to NHTSA’s 3.9 to 4.1 percent) and eight-speed automatic transmissions (1.5 to 2.0 percent compared to NHTSA’s 4.6 to 5.3 percent), the committee’s low and high range of most likely estimates were lower than NHTSA’s estimates.
In addition to listing technologies defined by EPA and NHTSA, Table 8A.1 also lists the effectiveness estimates of other technologies not considered by EPA and NHTSA that may be available either by the 2025 MY or later, extending to the 2030 MY. The technologies that might be available by the 2025 MY could provide additional reductions in fuel consumption or, possibly, alternative approaches at lower cost. In addition, the committee has identified several technologies that might be available after 2025, although these technologies are generally in the research phase of development. Technologies using alternative fuels may also provide some opportunities for reductions in fuel consumption.
Costs of Technologies
The direct manufacturing costs of technologies for reducing fuel consumption were estimated by (1) developing cost estimates for key subsystems and components for each technology, (2) using the detailed cost teardown studies conducted by EPA with appropriate updates, (3) considering input from the vehicle manufacturers and suppliers, (4) referring to the Phase 1 NRC Study, and (5) evaluating estimates provided by experts through presentations and publications. These low and high most likely cost estimates for the technologies, discussed in the earlier chapters, are shown in Tables 8A.2a, b, and c for the 2017, 2020, and 2025 MYs, respectively. Tables 8A.2a, b, and c also show costs estimates for technologies not considered by EPA and NHTSA that may be available either by the 2025 MY or later, extending to the 2030 MY. For reference, EPA and NHTSA cost estimates contained in the TSD (EPA/NHTSA 2012a) are shown in Appendix S, Tables S.2a, b, and c.
The committee’s estimates of direct manufacturing costs are comparable to NHTSA’s estimates for some of the
technologies defined by NHTSA. The committee extended the range to include higher estimates of direct manufacturing costs for some of these technologies, including several SI engine technologies, several transmission technologies, and electrified powertrain technologies. The ranges of most likely direct manufacturing costs for several technologies, including advanced diesel engines (with an estimated cost of $2,572 for an I4 advanced diesel engine for a midsize car compared to NHTSA’s estimate of $1,752 in 2025), several transmission technologies (including a high-efficiency gearbox with an estimated cost of $267 compared to NHTSA’s estimate of $163), and mass reduction (ranging from $0.43 to $1.15 per pound for cars compared to NHTSA’s estimate of $0.35 per pound for 10 percent mass reduction in 2025), were higher than NHTSA’s estimates.
Cost analyses made by EPA and NHTSA were generally based on a production assumption of 450,000 units per year. Although this production volume may be valid for very high-volume vehicles, typical vehicles from one manufacturer will have significantly lower annual production volumes. In addition, one vehicle line will tend to have several engines and transmissions, which further lowers the production volume of engine- and vehicle-specific components.
For newer technologies, the assumption of 450,000 units per year appears to be optimistic. For example, electric vehicles are assumed to be 2 percent of the U.S. fleet in 2025. Assuming a total fleet of 16 million vehicles, 2 percent is 320,000 units per year. However, this volume may not be concentrated in industry common components but distributed among many manufacturers, which could reduce the volume for a particular manufacturer to 32,000 units per year or less and negatively impact the costs relative to the assumption of 450,000 units per year industry volume. EPA and NHTSA have recognized the need to represent low volume introductions with costs that exceed these estimates based on mature production volumes by applying the concept of negative learning, which is described later in the chapter.
Relative Effectiveness and Cost
The effectiveness and cost of technologies listed in Tables 8A.1 and 8A.2a, b, and c are dependent on the application of the specific technology. Since the technologies may be applied differently, Tables 8A.1 and 8A.2a, b, and c contain the column labeled “Relative To” to define the specific application. The initial technologies within a category are generally shown relative to the baseline, which is considered to be the baseline, or null vehicle, discussed previously. Subsequent technologies may be shown as “Relative To” one of the following: (1) the baseline, or null vehicle, (2) the previously applied technology listed in the table, or (3) another defined reference condition. For example, all of the “Other Technologies” in the diesel engine category are shown relative to the Advanced Diesel technology since they depend on this technology having been previously implemented.
For the mass reduction sections of Tables 8A.1 and 8A.2a, b, and c, effectiveness and costs are shown in two formats; one is for the mass reduction relative to the baseline vehicle, such as 0-10 percent mass reduction and the other is for the mass reduction relative to the previous mass reduction, such as for the 5-10 percent mass reduction increment. A transition occurs at 15 percent mass reduction, which will likely involve a change from a vehicle with high-strength steel to one with an aluminum body. This transition is shown in the tables as follows:
- Table 8A.1 shows fuel consumption reductions for the aluminum body vehicle for two cases. For the 0-15 percent mass reduction case, 9.15 percent reduction in fuel consumption is shown relative to the original baseline. For the 10-15 percent mass reduction case, only a 3.25 percent reduction in fuel consumption is shown relative to the previous mass reduction, which would be the case of having already achieved 10 percent mass reduction with the high-strength steel vehicle. This case is considered the most likely assumption for the transition from high-strength steel to aluminum-body vehicles.
- Tables 8A.2a, b, and c show the costs for the aluminum-body vehicle as relative to the baseline for both the incremental 10-15 percent and for the absolute 0-15 percent mass reduction cases. The reason for this is that the previous high-strength steel body vehicle, which achieved 10 percent mass reduction, cannot be reused for the aluminum-body vehicle, so the costs are reset back to the original baseline vehicle. The table shows that the cost of the aluminum body vehicle is the same whether the starting point is the original baseline vehicle or the high-strength steel body vehicle that has already achieved a 10 percent mass reduction.
Learning Curves
EPA and NHTSA developed learning curves that provide learning factors as a function of the model year. Examples of these learning curves are shown in Figure 8.1. An important feature of the learning curve is the basis, which is the year in which the learning factor equals 1.00, indicating that the technology is mature. NHTSA defines a mature technology as one that has reached a production volume of 450,000 units per year in North America. The learning factor is applied to the direct manufacturing cost for the base year to determine the direct manufacturing costs for the other years of interest. The effects of learning curves are reflected in the estimated direct manufacturing costs shown in Tables 8A.2a, b, and c. Generally the committee applied the same learning curves used by NHTSA, although a learning curve different from NHTSA’s assumption was used for mass reduction, as discussed in Chapter 6. A variety of learning curves is shown in Figure 8.1. Learning curve 6 is flat with no learning,
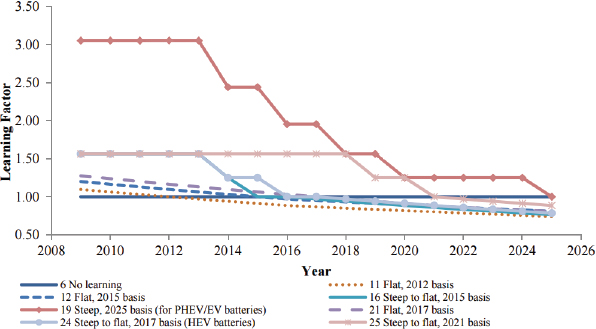
FIGURE 8.1 Learning factors for several different learning curves.
SOURCE: NHTSA (2012).
which, for example, was applied to low friction lubricants. Typical learning curves have a basis in 2012, 2015, or 2017. However, learning curves for newer technologies have their basis as late as 2025. The base year of these learning curves tends to be preceded by steep learning schedules, which is the concept of applying negative learning to estimate the costs of new technologies during early, low-volume introductions into production. Steep learning curves assume 20 percent decreases in the learning factor every 2 years during the initial years of production, for a maximum of two learning cycles, before converting to the flatter learning curves.
Interaction of Technologies
EPA and NHTSA discussed technologies in their joint TSD relative to a null vehicle. NHTSA structured its analysis in the RIA so that each successive technology is added to the preceding technology and the fuel consumption reduction effectiveness values are dependent on and incremental to each of the previous technologies that have already been applied (NHTSA 2012). In many cases, this means accounting for synergies among technologies.2
NHTSA used decision trees to illustrate the order of application of technologies and the effectiveness of a technology relative to previous technologies. An excerpt of a decision tree for a midsize car is shown in Figure 8.2. In this decision tree, turbocharging and downsizing—level 1 is shown to have an incremental effectiveness of 8.3 percent relative to the previous technologies, which included friction reduction, variable valve timing and lift, and stoichiometric gasoline direct injection. The relative effectiveness shown in the decision tree is consistent with the 12.9 to 14.9 percent effectiveness relative to the baseline null vehicle shown in the TSD. The lower effectiveness shown in the decision tree results from the application of a technology that reduces friction and pumping losses and improves thermodynamic efficiency after many other technologies have already been applied that provided similar improvements. This example illustrates the significant reduction in effectiveness that depends on the order in which a technology is applied. Effectiveness values for SI engine technologies shown in Table 8A.1 are relative to the previously applied technologies. The order of application of the technologies listed in the table follow the order developed by NHTSA in the decision trees.
Accounting for interaction of multiple technologies was important when combining technologies in the order presented in Table 8A.1. The effects of potential positive and negative synergies were considered. EPA and NHTSA identified the effects of interactions using the lumped parameter model, which was validated using the Ricardo full system simulations (Ricardo Inc. 2011). Many of the committee’s interactions were directly scaled from interaction effects that had been defined by NHTSA in the RIA and in the decision trees. To confirm that the interactions of technologies were
_____________
2 Two or more technologies applied together might be negatively synergistic, meaning that the sum of their effects is less than the impact of the individual technologies (contributes less to reducing fuel consumption, in this case). Or, they might be positively synergistic, meaning that the sum of the technologies’ effects is greater than the impact of the individual technologies (in this case, contributes more to reducing fuel consumption) (EPA/NHTSA 2009).

FIGURE 8.2 Excerpt from NHTSA’s decision tree for a midsize car.
SOURCE: NHTSA (2012).
appropriately accounted for, the committee contracted with the University of Michigan to conduct full system simulations. The results of the full system simulations, described later in this chapter, generally agreed with the interactions developed by EPA and NHTSA.
Effect of Engine Downsizing on Costs
An important factor affecting costs of turbocharged, downsized engines is downsizing displacement. In some downsizing cases, the number of cylinders is reduced instead of continuing to proportionally downsize the displacement of each cylinder. NHTSA recognized that there are limits to reducing cylinder size since heat losses increase with smaller cylinder displacements. As shown in Table 8.1, NHTSA specified the cases in which displacement reduction requires a reduction in the number of cylinders (NHTSA 2012). The committee followed the same schedule shown in Table 8.1 for reducing the number of cylinders.
Costs for turbocharging and downsizing are shown in the TSD relative to the null vehicle. However, since NHTSA assumes that turbocharging and downsizing occur after the application of many other engine technologies, turbocharging and downsizing costs need to be adjusted, as shown for the example of an I4 engine downsized to an I3 engine in a midsize car in Table 8.2. All of the previously applied technologies for the four cylinders of the baseline engine need to be reduced to only three cylinders to provide cost savings
TABLE 8.1 Changes in Number of Cylinders as Engines Are Downsized
| Base Engine | 18-bar Engine | 24-bar Engine | 27-bar Engine | ||||||||||||||||
| I4 | I4 | I3 | I3 | ||||||||||||||||
| V6 | I4 | I4 | I4 | ||||||||||||||||
| V8+ | V6 | V6 | I4 | ||||||||||||||||
| Baseline: | I4 Engine | Incremental Costs ($) |
| Previously Added Features (Cylinder Number Dependent) | LUB2 × 4 | 51 |
| EFR1 × 4 | 49 | |
| DVVL x 4 | 116 | |
| SGDI x 4 | 186 | |
| Total Deleted Costs | 402 | |
| Turbocharged Downsized Engine | I3 Engine | Incremental Costs ($) |
| Downsizing I4-I3 (TSD Table 3-32) | TSD Table 3-32 | -174 |
| Turbocharging (TSD Table 3-31) | TSD Table 3-31 | 182 |
| Previously Added Features (Cylinder Number Dependent) | LUB2 × 3 | 38 |
| EFR1 × 3 | 37 | |
| DVVL x 3 | 87 | |
| SGDI x 3 | 140 | |
| Total Added Costs | 310 | |
| Net Cost | -92 | |
NOTE: Direct manufacturing costs (2010$) based on NHTSA decision trees, cost files, and TSD.
that are in addition to the savings from reducing the number of cylinders. Similar adjustments are applied to the costs for a V8 engine downsized to a V6 engine and a V6 engine downsized to an I4 engine. The resulting revised costs are noted with asterisks and are shown on the shaded rows in Tables 8A.2a, b, and c for cases where the number of cylinders is reduced. These costs on the shaded rows are shown below the costs for turbocharged, downsized engines without a change in the number of cylinders. A complete description of the derivation of turbocharged, downsized engine costs shown in Table 8A.2 is provided in Appendix T.
Synergies
The effectiveness values of technologies for reducing fuel consumption are generally defined in the TSD (EPA/NHTSA 2012a) relative to a null, or baseline, vehicle. However, when adding a new technology to a vehicle that already contains other technologies for reduced fuel consumption, NHTSA developed a method for accounting for positive and negative synergies. The method is briefly described in this section and subsequently applied in several of the committee’s estimates, shown in Table 8A.2 and in an example pathway described later in this chapter.
NHTSA defined decision trees that consist of separate paths for SI engines, diesel engines, transmissions, accessories, hybrids, mass reduction, low rolling resistance tires, aerodynamic drag reduction, and low drag brakes and secondary axle disconnect. These decision trees will also be discussed in a later section of this chapter. Within each decision tree path, successive technologies are applied and their effectiveness values are shown relative to the preceding technology, rather than to the null, or baseline, vehicle. NHTSA generally determined these application-specific effectiveness values by applying the lumped parameter model, which was previously validated by the full system simulations developed by Ricardo (Ricardo Inc. 2011).
NHTSA developed another method for accounting for synergies when crossing over to another decision tree path, such as adding technologies from the transmission path after the applicable technologies in the SI engine path had been added. For the case of crossing over to other decision tree paths, NHTSA developed Tables V-30a-f in its RIA (NHTSA 2012). These tables list technology pairings and incremental synergy factors associated with those pairings. The incremental synergy factors for all instances of a technology in the incremental synergy tables that match technologies already applied to the vehicle are summed and applied to the percent reduction in fuel consumption of the technology being applied.
Examples of applying the synergy factors for technologies from the transmission decision tree path to an engine that already has all of the technologies in the SI engine decision tree path are shown in Table 8.3. As shown in the table, the adjusted percent reductions in fuel consumption of several transmission technologies are significantly reduced relative to the baseline engine when applied to an engine containing all of the fuel consumption reduction technologies. The relatively close agreement of the adjusted percent reductions in fuel consumption with estimates using the lumped parameter model is shown in the table for reference. The ratios of the adjusted percent fuel consumption reduction to the base
| Applying NHTSA Method Using NHTSA RIA Tables V-30 a-c for a Midsize Car | |||||||||||||||||||
| Technology | % FC Impr. (Relative to Base [Null] Engine) | Synergy Factor Pairs | Synergy Factor | Adjusted % FC Impr. | Notes | Ref: Lumped Parameter Model % FC Impr. | |||||||||||||
| Engine Decision Tree Path | |||||||||||||||||||
| ICP | |||||||||||||||||||
| DCP | |||||||||||||||||||
| CVVL | |||||||||||||||||||
| SGDI | |||||||||||||||||||
| TRBDS1 | |||||||||||||||||||
| TRBDS2 | |||||||||||||||||||
| CEGR1 | |||||||||||||||||||
| CEGR2 | |||||||||||||||||||
| Transmission Decision Tree Path | |||||||||||||||||||
| IATC | 3.0 | Sum of Synergy Factors | -1.4 | 1.6 | 3.0 - 1.4 = 1.6 | 0.8 | |||||||||||||
| IATC - ICP | -1.6 | ||||||||||||||||||
| IATC - CVVL | -0.6 | ||||||||||||||||||
| TRBDS1 - IATC | -0.8 | ||||||||||||||||||
| IATC - TRBDS1 | 1.6 | ||||||||||||||||||
| NUATO | 2.0 | Sum of Synergy Factors | -2.0 | 0.0 | 2.0 - 2.0 = 0 | 0.3 | |||||||||||||
| (6 sp AT) | NUATO - ICP | -1.2 | |||||||||||||||||
| TRBDS2 - NUATO | -1.2 | ||||||||||||||||||
| CEGR2 - NUATO | -0.8 | ||||||||||||||||||
| NUATO - TRBDS1 | 1.2 | ||||||||||||||||||
| 8 sp AT | 4.6 | Sum of Synergy Factors | -0.7 | 3.9 | 4.6 - 0.7 = 3.9 | 3.8 | |||||||||||||
| 8 sp AT - ICP | -2.5 | ||||||||||||||||||
| 8 sp - CVVL | -0.7 | ||||||||||||||||||
| 8 sp AT - TRBDS | 2.5 | ||||||||||||||||||
| SHFTOPT | 4.1 | Sum of Synergy Factors | -1.3 | 2.8 | 4.1 - 1.3 = 2.8 | 3.1 | |||||||||||||
| DCP - SHFTOPT | -0.6 | ||||||||||||||||||
| TRBDS2 - SHFTOPT | -0.7 | ||||||||||||||||||
fuel consumption reduction values shown in Table 8.3 were applied in the committee’s estimates of transmission technologies in Tables 8A.1 and 8A.2 for example pathways discussed later in this chapter.
Cost Effectiveness of Technologies
The cost effectiveness of the technologies defined by NHTSA for SI engines is illustrated in Figure 8.3. The NHTSA-defined technologies are shown on the plot of NRC estimated incremental 2025 MY direct manufacturing cost in 2010 dollars versus percent reduction in fuel consumption. Lines of constant cost per percent reduction in fuel consumption are overlaid on the plot to illustrate the cost effectiveness of the technologies. The costs per percent reduction in fuel consumption for the SI engine technologies range from less than $25 per percent to more than $100 per percent.
The cost effectiveness values of NHTSA’s technologies for overall SI engine technologies leading to a 27 bar BMEP engine as well as for advanced diesel engine and strong hybrid technologies are shown in Figure 8.4. The 2025 MY direct manufacturing cost per percent reduction in fuel consumption of an SI engine with all of NHTSA’s technologies included is less than $50 per percent, which is lower than advanced diesel engines and strong hybrids, which are in the range of $75 to $100 per percent reduction in fuel consumption. The cost per percent reduction in fuel consumption of a mild hybrid exceeds $100 per percent.
The cost of some of the SI engine technologies, especially cooled exhaust gas recirculation (EGR)—level 2 at over
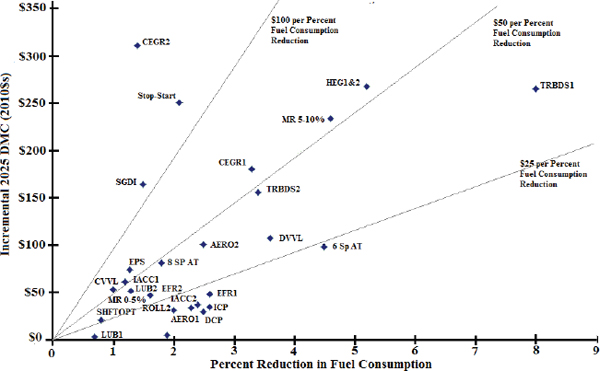
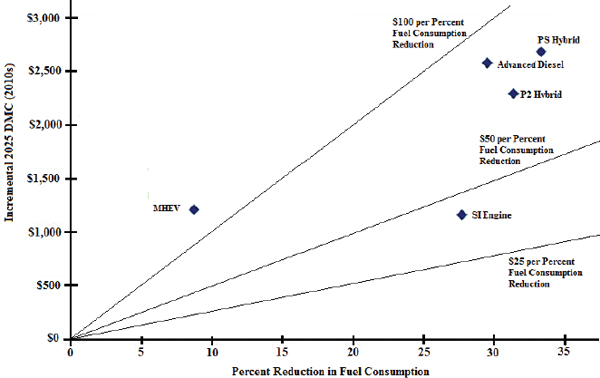
$200 per percent reduction in fuel consumption, significantly exceed the cost of hybrids and diesels at less than $100 per percent, as shown in Figure 8.4. This suggests that the most cost-effective approach for a manufacturer may include the selective application of hybrids and diesels before considering the more expensive SI engine technologies, with cost exceeding $100 per percent reduction in fuel consumption.
The committee developed a technology pathway example to illustrate the overall effectiveness and cost of applying many of the technologies discussed in the previous technology chapters to a specific vehicle. Important factors in developing a technology pathway include sequencing of the technologies and synergies of the technologies within a decision tree path and across such paths.
It is critical that the results of the committee’s technology pathway examples not be interpreted as assessments of the compliance costs for the 2017-2025 standards. Assessing compliance costs was not part of the charge to the committee, and given limitations on the committee’s resources to model fleet and vehicle models in more detail, it did not estimate such costs. As discussed in Chapter 10, the models used by NHTSA and EPA for estimating the cost of compliance track technology additions for approximately 1,300 separate vehicle models through the compliance period (2017-2025). These models also take into account the various crediting provisions described in Chapter 10 that the Agencies are permitted to use in determining the stringency of the standards. The committee notes that a simple “roll-up” of the NRC’s cost and effectiveness estimates for the technologies in the Agencies’ compliance demonstration path for a sample vehicle cannot be used to estimate future compliance costs. An estimate of compliance costs would require similar roll-ups for all vehicles together with consideration of flexibilities (including credits for air conditioning, off-cycle technologies, alternative fuel and advanced technology vehicles, and the banking and trading of credits) that reduce compliance costs. Such analysis was well beyond the committee’s resources and capabilities. Instead, the committee looked at costs and technology benefits for three representative vehicles and did not estimate the full impacts of the various flexibilities available to OEMs. Nevertheless, technology roll-ups are a convenient device for illustrating the aggregate fuel consumption reductions and costs of technology packages, and the analysis in the following sections provides such examples for that reason. Such an approach was used in earlier NRC reports on fuel economy technologies (NRC 2002, 2011).
Sequencing of Technologies
The NRC Phase 1 (NRC 2011) report identified the following factors that a vehicle manufacturer will consider, at a minimum, when implementing technologies to reduce fuel consumption:
- Cost effectiveness, which is defined as the incremental cost per percent reduction in fuel consumption ($/% FC);
- Ability to integrate the technology into the vehicle and engine cycle plans;
- Impact on vehicle performance characteristics and other functional characteristics;
- Applicability to the specific product or vehicle class; and
- Customer acceptance.
The following considerations were applied in ranking the technologies for the example pathway:
- EPA and NHTSA defined a null, or baseline, vehicle, which was used as the starting point for the pathway.
- The technologies were ranked in the order of cost effectiveness wherever possible. Exceptions to this ranking of technologies include the following:
- —A less cost-effective technology will precede a more cost-effective technology if the less cost-effective technology is required prior to implementation of the more cost-effective technology. For example, stoichiometric gasoline direct injection does not rank high on the basis of cost effectiveness but is considered to be a requirement before turbocharging and downsizing can be applied.
- —Some technologies require more development time before being available for production implementation. The technology must be implementation-ready 3 to 5 years before production implementation, which is in contrast to a future development being explored in the research laboratory. Implementation readiness implies that all aspects of the technology have been proven, including function, durability, reliability, cost, and supplier readiness. Some potentially attractive technologies cannot be considered because they are not implementation-ready.
- Some technologies are considered by NHTSA to be applicable anytime, such as improved accessories, but are generally ranked in the order of cost effectiveness.
Since NHTSA uses decision trees to determine the order in which technologies are applied to a vehicle, the committee followed a similar approach in developing pathways. The following decision trees were utilized in developing the pathways: Engine Technology, Transmission, Mass Reduction, Low Rolling Resistance Tires, Low Drag Brakes, Aerodynamic Drag Reductions, Electrification/Accessory, and Hybrid Technology. These decision trees are shown in Figures 8.5, 8.6, and 8.7.
The decision trees provide the sequence for applying individual technologies to vehicles in NHTSA’s Volpe model and
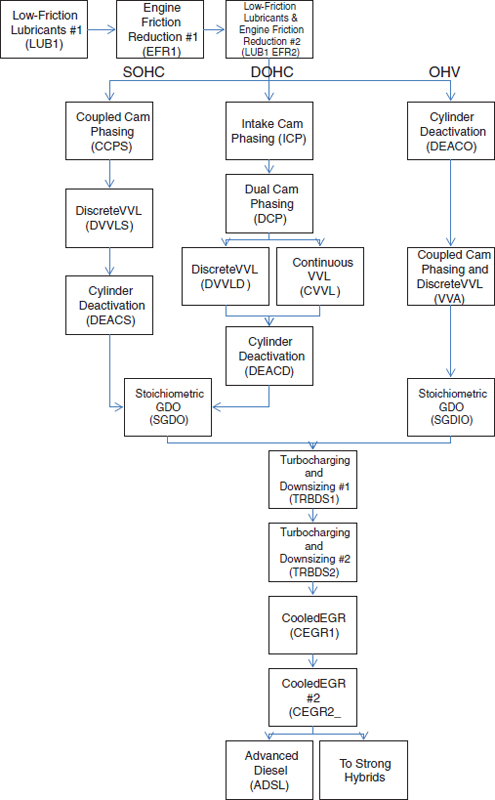
FIGURE 8.5 Engine technology decision tree.
SOURCE: NHTSA (2012).
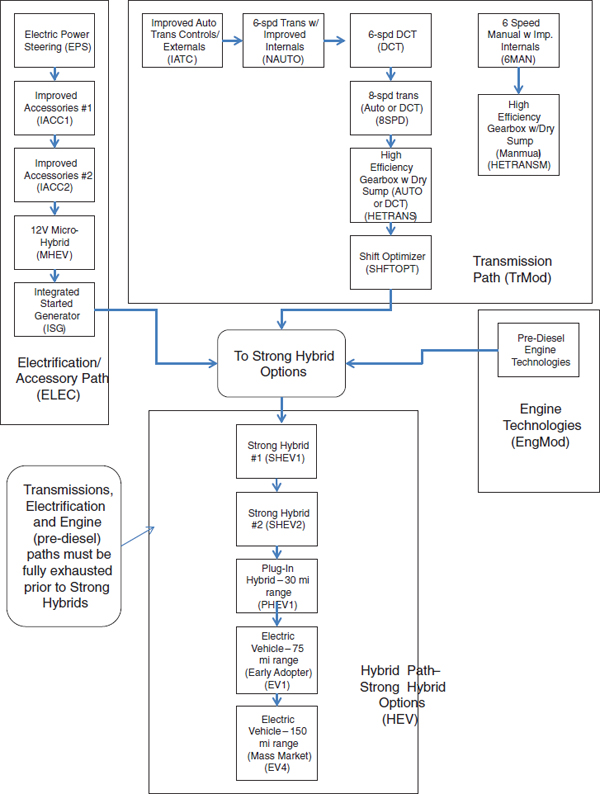
FIGURE 8.6 Electrification/accessory, transmission, and hybrid technology decision tree.
SOURCE: NHTSA (2012).
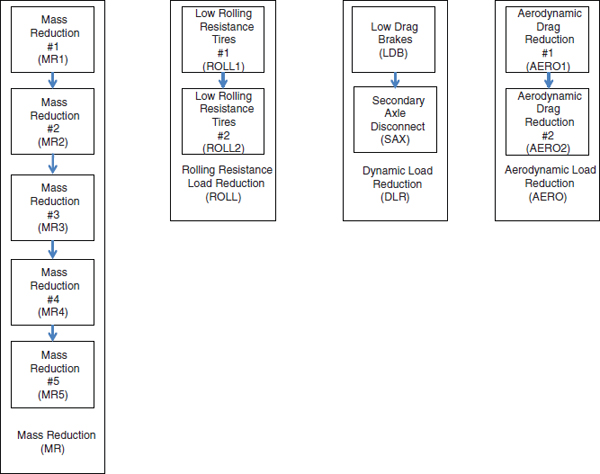
FIGURE 8.7 Vehicle technology decision tree.
SOURCE: NHTSA (2012).
have generally been followed in developing the committee’s pathways. For the engine decision trees, several pathways are provided for different valve configurations, including DOHC, single overhead camshaft (SOHC), and OHV. For the first level of a turbocharged, downsized engine (TRBDS1), all engines are converted to DOHC configurations so that there are no longer any path-dependent variations. After all of the available SI engine technologies have been applied, the decision tree splits either to the advanced diesel or to the hybrid pathway.
The transmission decision tree follows the general pathway that includes a six-speed automatic transmission with improved controls and external features, a possible transition to a DCT, followed by an eight-speed transmission and a high-efficiency gearbox. The hybrid decision tree begins with electrified accessories, followed by stop-start, integrated starter generator followed by strong hybrids, followed by plug-in hybrids and electric vehicles. The vehicle technology decision trees provide a progression of more advanced technologies for mass reductions, low rolling resistance tires, low drag brakes and other vehicle driveline technologies, and aerodynamic drag reduction.
The pathways developed by the committee followed the fuel consumption reduction and cost methodologies that are used by NHTSA to ensure that synergies are properly included within each pathway. Detailed decision trees that include NHTSA’s accounting of effectiveness and cost for each technology in the pathways are provided at the NHTSA fuel economy website.
Committee Example of Technology Pathway
The example technology pathway developed by the committee illustrates the process of combining the technologies discussed in this study. As described in the preceding section, the criteria for adding technologies in the pathway consisted of (1) cost effectiveness, (2) prerequisite technical requirements, (3) applicability to the specific product, and (4) implementation readiness. Technologies applied in the example here include only NHTSA-defined technologies,
as these were the technologies for which the committee had the most complete information on effectiveness, costs, and interaction with other technologies. However, the committee applied mass reduction up to 10 percent, in keeping with Finding 6.2 in Chapter 6; this was in contrast to the Agencies, which limited mass reduction for midsize cars to 3.5 percent in their compliance scenario. The technology pathway example for a midsize car with an I4 DOHC SI engine is shown in Tables 8.4a and b using the committee’s low and high most likely estimates. Cost effectiveness values are shown in the right column of the example pathway. The pathway begins with the null vehicle identified above the “Possible Technologies” column. As noted earlier, the null vehicle was defined by EPA and NHTSA as a vehicle having a naturally aspirated engine, four valves per cylinder, fixed valve timing and lift and a four-speed automatic transmission. Although the Agencies’ analysis began with the 2008 MY, very few vehicles in 2008 had only the content of the null vehicle. Many 2008 vehicles contained some of the early EPA and NHTSA technologies. The committee reviewed the best-selling vehicles in the midsize vehicle classification. An example vehicle was selected that had the CAFE fuel economy closest to the average of the best-selling vehicles. The additional technologies included in this specific vehicle that were additions to the null vehicle were identified. These technologies were applied first in the pathways so that the example vehicle could be aligned with the 2008 MY, as shown in Table 8.4.
As additional technologies are applied in the pathway, the fuel consumption reductions are derived from a multiplicative combination of one minus the individual estimated fuel consumption reduction fraction (percent reduction divided by 100), while the cumulative costs are derived from an addition of the individual costs. This approach was used in earlier NRC reports to represent the fuel consumption benefits of multiple technologies (NRC 2002, 2011). These fuel consumption reductions are converted to miles per gallon, based on the EPA certification CAFE fuel economy of the example vehicle. The 2016 and 2025 CAFE targets for the example vehicle, based on its footprint, are indicated at the appropriate locations along the pathway. The direct manufacturing costs for 2017, 2020, and 2025 are listed for each technology and are then added to provide a cumulative direct manufacturing cost for the pathway. The pathway shows the cumulative direct manufacturing costs of the technologies applied to the null vehicle to the 2016 time frame, the technologies applied in the 2017 to 2025 time frame, and the technologies that may be available beyond 2025.
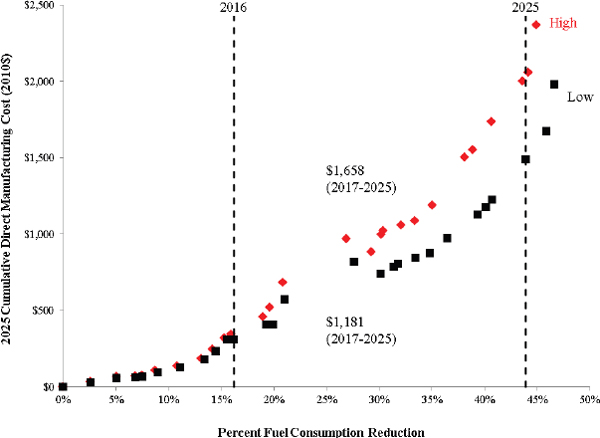
The results from the example pathway for a midsize car with an I4 SI engine using the committee’s low and high most likely estimates are summarized in Figure 8.8. Applying technologies in the order of cost effectiveness results in the increasing incremental direct manufacturing costs per percent reduction in fuel consumption, as shown in the figure. As shown in Tables 8.4a and b and illustrated in Figure 8.8, the cost effectiveness of technologies range from under $10 per percent reduction in fuel consumption to a high of $260 per percent reduction in fuel consumption for cooled EGR—level 2. This example pathway shows the low and high most likely estimates of the direct manufacturing costs to reach the 2016 CAFE target, which becomes the baseline for achieving the 2025 CAFE target for this example vehicle. As shown in Figure 8.8, both the lower pathway, which uses the low cost and high effectiveness combinations, and the higher pathway, which uses the high cost and low effectiveness combinations, reach the 2025 target without exhausting the available NHTSA-defined technologies. As noted above, both pathways include 10 percent mass reduction, unlike NHTSA’s compliance scenario. Pathways were not developed for other vehicle classifications to determine the ability of the NHTSA-defined technologies to reach the 2025 MY CAFE target.
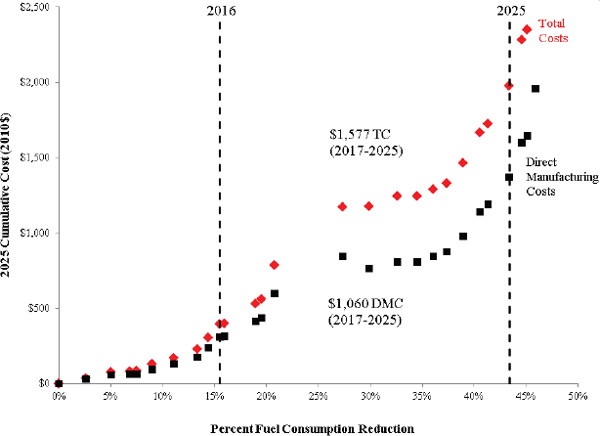
A similar pathway using NHTSA estimates for both direct manufacturing cost and total costs is provided in Appendix U for reference and summarized in Figure 8.9. The committee’s estimates are compared with NHTSA’s estimates in Table 8.5. To achieve the CAFE target for the 2025 MY from the 2016 MY baseline, the committee’s example calculation of cumulative direct manufacturing cost estimates exceeded the estimate using NHTSA’s technology cost and effectiveness estimates by 11 percent in the lower pathway and by 56 percent in the higher pathway. This was due to lower committee effectiveness estimates for some technologies and higher cost estimates for other technologies. It is important to note that these calculations did not include full CAFE/GHG program flexibilities so are not intended to be an estimate of actual compliance costs. In this example, technologies were applied to achieve the CAFE targets without consideration of other vehicles in a manufacturer’s fleet and without consideration of credits. The results for other vehicle classifications may vary considerably from this example.
Alternative Pathways
The pathways shown in Figure 8.8 were developed by applying technologies that were defined by NHTSA for SI engines, transmissions, and vehicle technologies in the TSD together with 10 percent mass reduction. As shown in Tables 8A.1 and 8A.2, the committee also identified other technologies with the potential for additional reductions in fuel consumption or possibly lower cost alternatives to the technologies defined by NHTSA. Alternative pathways were developed using several of these technologies applied individually in addition to the NHTSA-defined technologies or in place of several NHTSA technologies. These pathways are provided in Appendix V and a summary of the results is shown in Table 8.6 and compared to the previously discussed example pathway using the committee’s effectiveness and cost estimates.
The first alternative technology was a high compression ratio with exhaust scavenging, followed by turbocharging
| Midsize Car with SI Engine Pathway with 10% MR - NRC Low Most Likely Estimates - Direct Manufacturing Costs (2010$) | |||||||||||||||||||
| Low Most Likely Cost Estimates Paired with High Most Likely Effectiveness Estimates | |||||||||||||||||||
| Possible Technologies | % FC Reduction | FC Reduction Multiplier | Cumulative FC Reduction Multiplier | Fuel Consumption (gal/100 mi) | Cumulative Percent FC Reduction | Unadjusted Combined FE (mpg) | 2017 Cost Estimates | 2020 Cost Estimates | 2025 Cost Estimates | 2017 Cost/Percent FC ($/%) | |||||||||
| Null Vehiclea | 1.000 | 1.000 | 3.240 | 0.0% | 30.9 | ||||||||||||||
| Intake Cam Phasing | 2.6% | 0.974 | 0.974 | 3.156 | 2.6% | 31.7 | $37 | $35 | $31 | $14.23 | |||||||||
| ICP | |||||||||||||||||||
| Dual Cam Phasing | 2.5% | 0.975 | 0.950 | 3.077 | 5.0% | 32.5b | $31 | $29 | $27 | $12.40 | |||||||||
| DCP (vs. ICP) | |||||||||||||||||||
| 2008 Example Vehicle | |||||||||||||||||||
| Low Rolling Resistance Tires - 1 | 1.9% | 0.981 | 0.932 | 3.018 | 6.8% | 33.1 | $5 | $5 | $5 | $2.63 | |||||||||
| ROLL1 | |||||||||||||||||||
| Low Friction Lubricants - 1 | 0.7% | 0.993 | 0.925 | 2.997 | 7.5% | 33.4 | $3 | $3 | $3 | $4.29 | |||||||||
| LUB1 | |||||||||||||||||||
| 6 Speed Automatic Transmissionc | 1.6% | 0.984 | 0.910 | 2.949 | 9.0% | 33.9 | $37 | $34 | $31 | $23.13 | |||||||||
| 6 SP AT with Improved Internals IATC | |||||||||||||||||||
| Aero Drag Reduction - 1 | 2.3% | 0.977 | 0.889 | 2.882 | 11.1% | 34.7 | $39 | $37 | $33 | $16.96 | |||||||||
| AERO1 | |||||||||||||||||||
| Engine Friction Reduction - 1 | 2.6% | 0.974 | 0.866 | 2.807 | 13.4% | 35.6 | $48 | $48 | $48 | $18.46 | |||||||||
| EFR1 | |||||||||||||||||||
| Improved Accessories - 1 | 1.2% | 0.988 | 0.856 | 2.773 | 14.4% | 36.1 | $71 | $69 | $60 | $59.17 | |||||||||
| IACC1 | |||||||||||||||||||
| Electric Power Steering | 1.3% | 0.987 | 0.845 | 2.737 | 15.5% | 36.5 | $87 | $82 | $74 | $66.92 | |||||||||
| EPS | |||||||||||||||||||
| Mass Reduction - 2.5% MR2.5 (-87.5 lbs) | 0.8% | 0.992 | 0.838 | 2.715 | 16.2% | 36.8 | $0 | $0 | $0 | $0.00 | |||||||||
| 2016 Target 36.6 mpg | |||||||||||||||||||
| Discrete Variable Valve Lift | 3.6% | 0.964 | 0.808 | 2.617 | 19.2% | 38.2 | $116 | $109 | $99 | $32.22 | |||||||||
| DVVL | |||||||||||||||||||
| Mass Reduction - 2.5%-5.0% MR5-MR2.5 (-87.5 lbs) | 0.8% | 0.992 | 0.801 | 2.596 | 19.9% | 38.5 | $0 | $0 | $0 | $0.00 | |||||||||
| Stoichiometric Gasoline Direct Injection | 1.5% | 0.985 | 0.789 | 2.557 | 21.1% | 39.1 | $192 | $181 | $164 | $128.00 | |||||||||
| SGDI (Required for TRBDS) | |||||||||||||||||||
| Turbocharging & Downsizing - 1 (I-4 to I-4) TRBDS1 33% DS 18 bar BMEP | 8.3% | 0.917 | 0.724 | 2.345 | 27.6% | 42.6 | $288 | $271 | $245 | $34.70 | |||||||||
| Turbocharging & Downsizing - 2 (I-4 to I-3) TRBDS2 50% DS 24 bar BMEP | 3.5% | 0.965 | 0.698 | 2.263 | 30.2% | 44.2 | -$92 | -$89 | -$82 | -$26.29 | |||||||||
| 8 Speed Automatic Transmissionc 8 SP AT | 1.7% | 0.983 | 0.687 | 2.225 | 31.3% | 45.0 | $56 | $52 | $47 | $32.94 | |||||||||
| Shift Optimizerc SHFTOPT | 0.7% | 0.993 | 0.682 | 2.209 | 31.8% | 45.3 | $26 | $24 | $22 | $37.14 | |||||||||
| Improved Accessories - 2 IAAC2 | 2.4% | 0.976 | 0.665 | 2.156 | 33.5% | 46.4 | $43 | $40 | $37 | $17.92 | |||||||||
| Low Rolling Resistance Tires ROLL2 | 2.0% | 0.980 | 0.652 | 2.113 | 34.8% | 47.3 | $58 | $46 | $31 | $29.00 | |||||||||
| Aero Drag Reduction - 2 AERO2 | 2.5% | 0.975 | 0.636 | 2.060 | 36.4% | 48.5 | $117 | $110 | $100 | $46.80 | |||||||||
| Mass Reduction - 5.0%-10.0% MR10-MR5 (-175 lbs) | 4.6% | 0.954 | 0.607 | 1.965 | 39.3% | 50.9 | $154 | $151 | $151 | $33.48 | |||||||||
| Low Friction Lub - 2 & Engine Friction Red - 2 LUB2_EFR2 | 1.3% | 0.987 | 0.599 | 1.940 | 40.1% | 51.6 | $51 | $51 | $51 | $39.23 | |||||||||
| Continuously Variable Valve Lift CVVL (vs. DVVL) | 1.0% | 0.990 | 0.593 | 1.920 | 40.7% | 52.1 | $58 | $55 | $49 | $58.00 | |||||||||
| High Efficiency Transmission HEG1 & 2 | 5.4% | 0.946 | 0.561 | 1.817 | 43.9% | 55.0 | $314 | $296 | $267 | $58.15 | |||||||||
| 2025 Target 54.2 mpg | |||||||||||||||||||
| Cooled EGR - 1 CEGR1 50% DS 24 bar BMEP | 3.5% | 0.965 | 0.541 | 1.753 | 45.9% | 57.0 | $212 | $199 | $180 | $60.57 | |||||||||
| Cylinder Deactivation DEACD | 0.0% | 1.000 | 0.541 | 1.753 | 45.9% | 57.0 | |||||||||||||
| Cooled EGR - 2 (I-3 to I-3) CEGR2 56% DS 27 bar BMEP | 1.4% | 0.986 | 0.533 | 1.729 | 46.7% | 57.9 | $364 | $343 | $310 | $260.00 | |||||||||
| Totals | |||||||||||||||||||
| Relative to Null Vehicle | 46.7% | 0.533 | $2,315 | $2,181 | $1,983 | $49.62 | |||||||||||||
| Null Vehicle - 2008 MY Vehicle | 5.0% | 0.950 | $68 | $64 | $58 | $13.51 | |||||||||||||
| 2008 MY Vehicle - 2016 MY | 11.8% | 0.882 | $290 | $278 | $254 | ||||||||||||||
| 2017 MY- 2025 MY | 33.1% | 0.669 | $1,381 | $1,297 | $1,181 | $41.74 | |||||||||||||
| Beyond 2025 MY | 4.9% | 0.951 | $576 | $542 | $490 | $118.74 | |||||||||||||
a Null vehicle: I4, DOHC, naturally aspirated, 4 valves/cylinder PFI fixed valve timing and 4 speed AT.
b An example midsize car in 2008 was 46.64 sq ft and had a fuel economy of 32.5 mpg. Its standard for MY2016 would be 36.6 mpg and for MY2025 would be 54.2 mpg.
c These technologies have transmission synergies included. Green highlighting indicates a technology order different than the NHTSA pathway, shown in Appendix S.
| Midsize Car with SI Engine Pathway with 10% MR - NRC High Most Likely Estimates - Direct Manufacturing Costs (2010$) | |||||||||||||||||||
| High Most Likely Cost Estimates Paired with Low Most Likely Effectiveness Estimates | |||||||||||||||||||
| Possible Technologies | % FC Reduction (%) | FC Reduction Multiplier | Cumulative FC Reduction Multiplier | Fuel Consumption (gal/100 mi) | Cumulative Percent FC Reduction | Unadjusted Combined FE (mpg) | 2017 Cost Estimates | 2020 Cost Estimates | 2025 Cost Estimates | 2017 Cost/Percent FC ($/%) | |||||||||
| Null Vehiclea | 1.000 | 1.000 | 3.240 | 0.0% | 30.9 | ||||||||||||||
| Intake Cam Phasing ICP | 2.6% | 0.974 | 0.974 | 3.156 | 2.6% | 31.7 | $43 | $41 | $36 | $16.54 | |||||||||
| Dual Cam Phasing DCP (vs. ICP) | 2.5% | 0.975 | 0.950 | 3.077 | 5.0% | 32.5 b | $35 | $33 | $31 | $14.00 | |||||||||
| 2008 Example Vehicle | |||||||||||||||||||
| Low Rolling Resistance Tires - 1 ROLL1 | 1.9% | 0.981 | 0.932 | 3.018 | 6.8% | 33.1 | $5 | $5 | $5 | $2.63 | |||||||||
| Low Friction Lubricants - 1 LUB1 | 0.7% | 0.993 | 0.925 | 2.997 | 7.5% | 33.4 | $3 | $3 | $3 | $4.29 | |||||||||
| 6 Speed Automatic Transmissionc 6 SP AT with Improved Internals IATC | 1.3% | 0.987 | 0.913 | 2.958 | 8.7% | 33.8 | $37 | $34 | $31 | $28.46 | |||||||||
| Aero Drag Reduction - 1 AERO1 | 2.3% | 0.977 | 0.892 | 2.890 | 10.8% | 34.6 | $39 | $37 | $33 | $16.96 | |||||||||
| Engine Friction Reduction - 1 EFR1 | 2.6% | 0.974 | 0.869 | 2.815 | 13.1% | 35.5 | $48 | $48 | $48 | $18.46 | |||||||||
| Improved Accessories - 1 IACC1 | 1.2% | 0.988 | 0.858 | 2.781 | 14.2% | 36.0 | $71 | $67 | $60 | $59.17 | |||||||||
| Electric Power Steering EPS | 1.3% | 0.987 | 0.847 | 2.745 | 15.3% | 36.4 | $87 | $82 | $74 | $66.92 | |||||||||
| Mass Reduction - 2.5% MR2.5 (-87.5 lbs) | 0.8% | 0.992 | 0.841 | 2.723 | 15.9% | 36.7 | $22 | $22 | $22 | $27.50 | |||||||||
| 2016 Target 36.6 mpg | |||||||||||||||||||
| Discrete Variable Valve Lift DVVL | 3.6% | 0.964 | 0.810 | 2.625 | 19.0% | 38.1 | $133 | $125 | $114 | $36.94 | |||||||||
| Mass Reduction - 2.5%-5.0% MR5-MR2.5 (-87.5 lbs) | 0.8% | 0.992 | 0.804 | 2.604 | 19.6% | 38.4 | $66 | $66 | $66 | $82.50 | |||||||||
| Stoichiometric Gasoline Direct Injection SGDI (Required for TRBDS) | 1.5% | 0.985 | 0.792 | 2.565 | 20.8% | 39.0 | $192 | $181 | $164 | $128.00 | |||||||||
| Turbocharging & Downsizing - 1 TRBDS1 33% DS 18 bar BMEP | 7.7% | 0.923 | 0.731 | 2.368 | 26.9% | 42.2 | $331 | $312 | $282 | $42.99 | |||||||||
| Turbocharging & Downsizing - 2 TRBDS2 50% DS 24 bar BMEP | 3.2% | 0.968 | 0.707 | 2.292 | 29.3% | 43.6 | -$96 | -$92 | -$86 | -$30.00 | |||||||||
| 8 Speed Automatic Transmissionc 8 SP AT | 1.3% | 0.987 | 0.698 | 2.262 | 30.2% | 44.2 | $151 | $126 | $115 | $116.15 | |||||||||
| Shift Optimizerc SHFTOPT | 0.3% | 0.997 | 0.696 | 2.255 | 30.4% | 44.3 | $26 | $24 | $22 | $86.67 | |||||||||
| Improved Accessories - 2 IAAC2 | 2.4% | 0.976 | 0.679 | 2.201 | 32.1% | 45.4 | $43 | $40 | $37 | $17.92 | |||||||||
| Low Rolling Resistance Tires ROLL2 | 2.0% | 0.980 | 0.666 | 2.157 | 33.4% | 46.4 | $58 | $46 | $31 | $29.00 | |||||||||
| Aero Drag Reduction - 2 AERO2 | 2.5% | 0.975 | 0.649 | 2.103 | 35.1% | 47.5 | $117 | $110 | $100 | $46.80 | |||||||||
| Mass Reduction - 5%-10% MR10-MR5 (-175 lbs) | 4.6% | 0.954 | 0.619 | 2.006 | 38.1% | 49.8 | $325 | $322 | $315 | $70.65 | |||||||||
| Low Friction Lub - 2 & Engine Friction Red - 2 LUB2_EFR2 | 1.3% | 0.987 | 0.611 | 1.980 | 38.9% | 50.5 | $51 | $51 | $51 | $39.23 | |||||||||
| Cooled EGR - 1 | 3.0% | 0.970 | 0.593 | 1.921 | 40.7% | 52.1 | $212 | $199 | $180 | $70.67 | |||||||||
| CEGR1 50% DS 24 bar BMEP | |||||||||||||||||||
| High Efficiency Transmission | 4.9% | 0.951 | 0.564 | 1.827 | 43.6% | 54.7 | $314 | $296 | $267 | $64.08 | |||||||||
| HEG1 & 2 | |||||||||||||||||||
| 2025 Target 54.2 mpg | |||||||||||||||||||
| Continuously Variable Valve Lift CVVL (vs. DVVL) | 1.0% | 0.990 | 0.558 | 1.809 | 44.2% | 55.3 | $67 | $63 | $56 | $67.00 | |||||||||
| Cylinder Deactivation DEACD | 0.0% | 1.000 | 0.558 | 1.809 | 44.2% | 55.3 | |||||||||||||
| Cooled EGR - 2 CEGR2 56% DS 27 bar BMEP | 1.4% | 0.986 | 0.550 | 1.783 | 45.0% | 56.1 | $364 | $343 | $310 | $260.00 | |||||||||
| Totals | |||||||||||||||||||
| Relative to Null Vehicle | 45.0% | 0.550 | $2,744 | $2,584 | $2,367 | $61.03 | |||||||||||||
| Null Vehicle - 2008 MY Vehicle | 5.0% | 0.950 | $78 | $74 | $67 | $15.49 | |||||||||||||
| 2008 MY Vehicle - 2016 MY | 11.5% | 0.885 | $312 | $298 | $276 | $27.15 | |||||||||||||
| 2017 MY- 2025 MY | 32.9% | 0.671 | $1,923 | $1,806 | $1,658 | $58.42 | |||||||||||||
| Beyond 2025 MY | 2.4% | 0.976 | $431 | $406 | $366 | $180.64 | |||||||||||||
a Null vehicle: I4, DOHC, naturally aspirated, 4 valves/cylinder PFI fixed valve timing and 4 speed AT.
b An example midsize car in 2008 was 46.64 sq ft and had a fuel economy of 32.5 mpg. Its standard for MY2016 would be 36.6 mpg and for MY2025 would be 54.2 mpg.
c These technologies have transmission synergies included. Green highlighting indicates a technology order different than the NHTSA pathway, shown in Appendix S.
| NRC Most Likely Estimates 2025 MY* | NHTSA Estimates 2025 MY | |
| Direct manufacturing costs in 2017-2025 time frame | 1,181 - 1,658 | 1,060 |
| Reference: Total cost | 1,577 | |
* Successive technologies were generally added to the pathways in Table 8.4 according to cost effectiveness. Adding the technology, High Efficiency Transmission, provided an incremental effectiveness which was larger than required to exactly meet the 2025 CAFE target. As a result, the Low Friction Lub and Engine Friction Reduction – Level 2 technology, which had been added earlier, could have been deleted from the pathway, thereby reducing the 2017-2025 direct manufacturing costs shown in this table by $51.
TABLE 8.6 Alternative Pathways for a Midsize Car with an I4 Gasoline Engine
| Pathway | Fuel Consumption Reduction (%) | 2025 MY Direct Manufacturing Cost (2010 dollars) | |||||||||||||||||
| Overall (From Null Vehicle) | 2017-2025 MY Time Frame | Overall (From Null Vehicle) | 2017-2025 Time Frame | ||||||||||||||||
| NHTSA Technologies with 10% Mass Reduction (Figure 8.9a and b) | 45.0 - 46.7 | 32.9 - 33.1 | 1,983 - 2,367 | 1,181 - 1,658 | |||||||||||||||
| High Compression Ratio with Exhaust Scavenging (In addition to TRBDS 1 and 2) | 48.3 - 49.9 | 32.8 - 33.7 | 2,233 - 2,617 | 1,115 - 1,641 (−17 to −66) | |||||||||||||||
| EAVS-Supercharger with partial MHEV Function (Replacing TRBDS1 and 2, SS, IACC1, IACC2) | 52.7 - 53.7 | 30.8 - 32.0 | 3,025 - 3,376 | 1,566 - 1,800 (+142 to +385) | |||||||||||||||
and downsizing. This technology was effective in reducing the direct manufacturing cost in the 2017 to 2025 MY time frame by $17 to $66 relative to the pathway using NHTSA-defined technologies with 10 percent mass reduction, as shown in Table 8.6. However, as indicated in Chapter 2, the future path for high compression ratio with exhaust scavenging is not clear with respect to the applicability of turbocharging and downsizing to this concept.
The next alternative technology was the electrically assisted variable speed (EAVS) supercharger system as a replacement for turbocharging to level 2, and improved accessories levels 1 and 2, as described in Chapter 2. The EAVS supercharger system also has the potential to provide stop-start and mild hybrid functions, although these features were not included in the pathways shown in Figure 8.8. The EAVS supercharger system increased overall effectiveness by 7 to 8 percent relative to the pathways shown in Figure 8.8. However, direct manufacturing cost in the 2017 to 2025 time frame increased by $142 to $385 relative to the pathways using NHTSA-defined technologies with 10 percent mass reduction, as shown in Table 8.6. This increase occurred because the EAVS supercharger system with cost effectiveness of $50 per percent reduction in fuel consumption replaced turbocharging and downsizing technology, which has lower cost effectiveness values. Although a reduction in cost was not shown for the 2017 to 2025 time frame, the additional reduction in overall fuel consumption provided by the EAVS supercharger system might provide either longer-term advantages or other opportunities compared to technologies with lower overall fuel consumption reduction. For example manufacturers mayoverachieve in a particular vehicle line by applying this technology while saving costs in another vehicle line, which then may require the application of fewer fuel consumption reduction technologies.
Application of Credits
EPA and NHTSA provide manufacturers with preapproved technologies that qualify for off-cycle credits. For the first time, NHTSA also is providing indirect credits in the 2017 to 2025 final CAFE rule for improvements in air conditioning efficiency. The air conditioning efficiency indirect credits and off-cycle credits are summarized in Table 8.7. The table also shows air conditioning direct leakage and low GWP credits for CO2, but these improvements do not have associated CAFE credits. For the analysis supporting the final CAFE rule, NHTSA assumed that off-cycle credits for active aerodynamics and stop-start technologies would be available to manufacturers for compliance with the CAFE targets, similar to the other available fuel-economy-improving technologies. Therefore, NHTSA included the assessment of off-cycle credits in the assessment of maximum feasible standards.
TABLE 8.7 Air Conditioning Efficiency and Off-Cycle Credits
| Car | Truck | ||||||||||||||||||
| CO2 g/mi | gal/mi | CO2 g/mi | gal/mi | ||||||||||||||||
| A/C Credits (Projected estimated use of credits) | |||||||||||||||||||
| Direct Leakage Credit (R-134a) (Not applicable to CAFE) | 6.3 | 7.8 | |||||||||||||||||
| Direct Credit for Low GWP A/C (Not applicable to CAFE) | 13.8 | 17.2 | |||||||||||||||||
| Indirect Credit (AC Efficiency) | 5 | 0.000563 | 7.2 | 0.00081 | |||||||||||||||
| Active Aerodynamic Improvements | |||||||||||||||||||
| 3% Reduction | 0.6 | 0.000068 | 1.0 | 0.000113 | |||||||||||||||
| Stop-Start (with heater circulation system) | 2.5 | 0.000282 | 4.4 | 0.000496 | |||||||||||||||
| Off Cycle Electrical Load Reduction (Lighting) | |||||||||||||||||||
| 100 W Reduction with high efficiency exterior lights | 1 | 0.000113 | 1.0 | 0.000113 | |||||||||||||||
| Solar Panels (75 watt) | 3.3 | 0.000372 | 3.3 | 0.000372 | |||||||||||||||
| Battery Charging Only | |||||||||||||||||||
| Active Transmission Warm-up | 1.5 | 0.000169 | 3.2 | 0.000361 | |||||||||||||||
| Active Engine Warm-up | 1.5 | 0.000169 | 3.2 | 0.000361 | |||||||||||||||
| Exhaust Heat | |||||||||||||||||||
| Secondary coolant loop | |||||||||||||||||||
| Solar/Thermal Control | Up to 3 | 0.000338 | Up to 4.3 | 0.000484 | |||||||||||||||
| Total | 0.002052 | 0.003105 | |||||||||||||||||
SOURCE: EPA/NHTSA (2012a).
The cost savings from air conditioning efficiency indirect credits and active aerodynamics off-cycle credits were evaluated using the example pathways for a midsize car. The two technologies provide a total credit of 0.000631gal/mi, as shown in Table 8.7, which lists the credits for the applicable technologies. The results from using this credit for the midsize car pathway are shown in Tables 8.8a and b for the most likely low and high cost estimates. The 2017 to 2025 MY costs for the example pathway with and without credits are compared in Table 8.9. By using the credit, the costs of the eight-speed automatic transmission and low friction lubricant with engine friction reduction—level 2 technologies used in the original pathways to reach the 2025 MY CAFE targets would be saved. Without these technologies, direct manufacturing cost savings of $98 to $166, or approximately 8 to 10 percent of the cumulative costs from 2017 to 2025 MY for this example pathway, would be realized. Although the cost savings of 8 to 10 percent are realized, the fuel consumption reduction was diminished by approximately 6 percent, since the technologies with the higher cost per percent fuel consumption reduction were selected for replacement by the credits. The savings from the application of credits were evaluated only for this example pathway, but the benefits of credits are expected to be directionally similar for other pathways. Although credits for only two technologies were applied in this example, the total possible credits listed in Table 8.9 exceed twice the sum of these two credits. However, most of the additional credits require additional costs to implement the technologies associated with the credits.
FULL SYSTEM SIMULATION MODELING OF FUEL CONSUMPTION REDUCTIONS
In order to further understand fuel consumption benefits, the committee contracted with experts at the University of Michigan’s Department of Mechanical Engineering (referred to as U of M throughout this section) to use full system simulation modeling to analyze the effects of technologies (Middleton et al. 2015). The committee recognizes that as more technologies are added to vehicles that are aimed at reducing the same type of losses, the possibility of overestimating fuel consumption reduction becomes greater. The results of the simulations assisted the committee in evaluating the aggregated fuel consumption reduction values provided by these technologies. However, it is important to note that full system simulation modeling for powertrains and vehicles requires a great deal of financial and human resources as well as specific engine and other vehicle data, which were beyond the scope of this study. Thus, the committee engaged U of M to look at a combination of critical technologies for an SI engine and automatic transmission powertrain for a single vehicle class in order to provide some
additional evidence for the committee’s estimates. Although other vehicle efficiency technologies are also important, a review of NHTSA’s analysis of synergies revealed that the largest synergies resulted from adding various combinations of powertrain technologies. Therefore, the limited scope of this full system simulation modeling was focused on the powertrain technologies. The committee did not use the results of the full system simulation modeling directly in its estimates of fuel consumption benefits, but it did use them as a way to understand the potential magnitude of the interactions among individual technologies.
Methodology
The approach used by U of M applies GT-Power, a widely used engine and powertrain simulation tool (Gamma Technologies n.d.), to analyze a series of engine and powertrain modifications that are expected to be available to engine manufacturers in the 2017-2025 time frame and to estimate their impact on overall vehicle fuel economy. The committee focused on benefits for a midsize passenger car. Because the models are physics-based and integrated, the effects of each change can be investigated step-by-step in a consistent manner to more accurately take into effect nonlinear influences and avoid double counting. The study focused solely on powertrain changes; accordingly, vehicle parameters such as test weight, drag coefficient, and rolling resistance were held constant. In addition, rear axle ratios, gear ratios, and engine sizes were chosen to ensure similar 0-60 mph acceleration for each configuration. With each vehicle configuration, drive cycle simulations were carried out over the standard fuel economy compliance test (the Federal Test Procedure [FTP] city cycle and highway cycle [HWY]) and a 0-60 acceleration mode. Each engine configuration was modeled to maintain, as closely as possible, the torque curve of the baseline naturally aspirated engine so that equal performance, as measured by 0-60 mph acceleration time, would be maintained.
Engine and Powertrain Model
A schematic of the model architecture is shown in Figure 8.10. The engine model consists of a number of physics-based submodels, including a standard entrainment combustion model, an autoignition integral knock model, and normal breathing, friction, and heat transfer models included within GT-Power. A turbocharged boost system was modeled using a generic turbocharger map, scaled where necessary depending on engine size. The transmission was modeled as a multispeed automatic configuration with a representative loss map specified as a function of speed, load, and drive ratio together with a torque converter map. A generic continuously variable transmission (CVT) was similarly modeled using a separate loss map derived from data for several modern CVT designs. In all cases, representative shift schedules and rear axle ratios were used and provided relatively constant 0-60 performance.
Powertrain Technologies
The powertrain technologies that were modeled relate to both engine and transmission and reflect several of the key technologies defined by NHTSA. The engine technologies include (in the order of application) valve train improvements using dual cam phasing (DCP), which allows independent adjustments to valve timing (included in the baseline 2012 vehicle); engine friction reduction and lubricant improvements; discrete variable valve lift (DVVL) or cam profile switching, which provides reductions in pumping work; gasoline direct injection (GDI), which provides better fuel control than port fuel injection (PFI) and cooling of the intake charge; boosted operation with a turbocharger (TC) and reduced engine displacement to reduce the relative contribution of friction and pumping losses; and cooled EGR (CEGR), which has been reported to reduce knock, especially with boosted engines, and provide additional benefits of dilute combustion. Transmission technologies included six- and eight-speed automatic transmissions (6 AT, 8 AT) as well as CVTs. In order to simulate in-use transmission behavior that would be acceptable to consumers, the time to execute a gear shift was set at 0.5 seconds, and the minimum time in any given gear before up or down shifting was set at 2 seconds.
Model Results
The results of the simulations are summarized in Table 8.10. Included in the table are the FTP, HWY, and combined cycle fuel economy results as well as the corresponding combined fuel consumption values. Also shown are the incremental and cumulative changes in fuel consumption. The incremental changes are relative to the previous powertrain configurations in the table.
As expected the simulations show that the current baseline (Task 3) is more efficient than the previous reference (Task 2). This change is due to a broadening of the optimal engine operating range resulting from the use of DCP. Beginning with the baseline Task 3 and progressing to Task 6, the results show a steady improvement in fuel economy with friction reduction, DVVL, and direct injection. The downsizing and boosting of Task 7 (33 percent downsizing) shows major improvement, while further downsizing in Task 8 (50 percent downsizing) shows additional gain. Interestingly, replacing the six-speed transmission with an eight-speed in Task 9 shows a small (0.4 percent) decrease in fuel economy, similar to what happened in a recent design of experiments simulation study examining a number of transmission features, which found only a small improvement (0.2 percent) in fuel economy when going from a six- to eight-speed transmission (Robinette 2014). Further optimization of the gear and final drive ratios, shift strategy,
| Midsize Car with SI Engine Pathway with 10% MR - NRC Low Most Likely Estimates - Direct Manufacturing Costs (2010$) | |||||||||||||||||||
| Low Most Likely Cost Estimates Paired with High Most Likely Effectiveness Estimates | |||||||||||||||||||
| Possible Technologies | % FC Reduction | FC Reduction Multiplier | Cumulative FC Reduction Multiplier | FC (gal/100 mi) | Cumulative Percent FC Reduction | Unadjusted Combined FE (mpg) | 2017 Cost Estimates | 2020 Cost Estimates | 2025 Cost Estimates | 2017 Cost/Percent FC ($/%) | |||||||||
| Null Vehiclea | 1.000 | 1.000 | 3.240 | 0.0% | 30.9 | ||||||||||||||
| Intake Cam Phasing (ICP) | 2.6% | 0.974 | 0.974 | 3.156 | 2.6% | 31.7 | $37 | $35 | $31 | $14.23 | |||||||||
| Dual Cam Phasing DCP (vs. ICP) | 2.5% | 0.975 | 0.950 | 3.077 | 5.0% | 32.5b | $31 | $29 | $27 | $12.40 | |||||||||
| 2008 Example Vehicle | |||||||||||||||||||
| Low Rolling Resistance Tires - 1 ROLL1 | 1.9% | 0.981 | 0.932 | 3.018 | 6.8% | 33.1 | $5 | $5 | $5 | $2.63 | |||||||||
| Low Friction Lubricants - 1 LUB1 | 0.7% | 0.993 | 0.925 | 2.997 | 7.5% | 33.4 | $3 | $3 | $3 | $4.29 | |||||||||
| 6 Speed Automatic Transmissionc 6 SP AT with Improved Internals IATC | 1.6% | 0.984 | 0.910 | 2.949 | 9.0% | 33.9 | $37 | $34 | $31 | $23.13 | |||||||||
| Aero Drag Reduction - 1 AERO1 | 2.3% | 0.977 | 0.889 | 2.882 | 11.1% | 34.7 | $39 | $37 | $33 | $16.96 | |||||||||
| Engine Friction Reduction - 1 EFR1 | 2.6% | 0.974 | 0.866 | 2.807 | 13.4% | 35.6 | $48 | $48 | $48 | $18.46 | |||||||||
| Improved Accessories - 1 IACC1 | 1.2% | 0.988 | 0.856 | 2.773 | 14.4% | 36.1 | $71 | $69 | $60 | $59.17 | |||||||||
| Electric Power Steering EPS | 1.3% | 0.987 | 0.845 | 2.737 | 15.5% | 36.5 | $87 | $82 | $74 | $66.92 | |||||||||
| Mass Reduction - 2.5% MR2.5 (-87.5 lbs) | 0.8% | 0.992 | 0.838 | 2.715 | 16.2% | 36.8 | $0 | $0 | $0 | $0.00 | |||||||||
| 2016 Target 36.6 mpg | |||||||||||||||||||
| Discrete Variable Valve Lift DVVL | 3.6% | 0.964 | 0.808 | 2.617 | 19.2% | 38.2 | $116 | $109 | $99 | $32.22 | |||||||||
| Mass Reduction - 2.5%-5.0% MR5-MR2.5 (-87.5 lbs) | 0.8% | 0.992 | 0.801 | 2.596 | 19.9% | 38.5 | $0 | $0 | $0 | $0.00 | |||||||||
| Stoichiometric Gasoline Direct Injection SGDI (Required for TRBDS) | 1.5% | 0.985 | 0.789 | 2.557 | 21.1% | 39.1 | $192 | $181 | $164 | $128.00 | |||||||||
| Turbocharging & Downsizing - 1 (I-4 to I-4) TRBDS1 33% DS 18 bar BMEP | 8.3% | 0.917 | 0.724 | 2.345 | 27.6% | 42.6 | $288 | $271 | $245 | $34.70 | |||||||||
| Turbocharging & Downsizing - 2 (I-4 to I-3) TRBDS2 50% DS 24 bar BMEP | 3.5% | 0.965 | 0.698 | 2.263 | 30.2% | 44.2 | -$92 | -$89 | -$82 | -$26.29 | |||||||||
| 8 Speed Automatic Transmissionc 8 SP AT | 1.7% | 0.983 | 0.687 | 2.225 | 31.3% | 45.0 | $56 | $52 | $47 | $32.94 | |||||||||
| Shift Optimizerc SHFTOPT | 0.7% | 0.993 | 0.682 | 2.209 | 31.8% | 45.3 | $26 | $24 | $22 | $37.14 | |||||||||
| Improved Accessories - 2 IAAC2 | 2.4% | 0.976 | 0.665 | 2.156 | 33.5% | 46.4 | $43 | $40 | $37 | $17.92 | |||||||||
| Low Rolling Resistance Tires ROLL2 | 2.0% | 0.980 | 0.652 | 2.113 | 34.8% | 47.3 | $58 | $46 | $31 | $29.00 | |||||||||
| Aero Drag Reduction – 2 (AERO2) | 2.5% | 0.975 | 0.636 | 2.060 | 36.4% | 48.5 | $117 | $110 | $100 | $46.80 | |||||||||
| Mass Reduction - 5.0%-10.0% MR10-MR5 (-175 lbs) | 4.6% | 0.954 | 0.607 | 1.965 | 39.3% | 50.9 | $154 | $151 | $151 | $33.48 | |||||||||
| Low Friction Lub - 2 & Engine Friction Red - 2 LUB2_EFR2 | 1.3% | 0.987 | 0.599 | 1.940 | 40.1% | 51.6 | $51 | $51 | $51 | $39.23 | |||||||||
| Continuously Variable Valve Lift CVVL (vs. DVVL) | 1.0% | 0.990 | 0.593 | 1.920 | 40.7% | 52.1 | $58 | $55 | $49 | $58.00 | |||||||||
| High Efficiency Transmission HEG1 & 2 | 5.4% | 0.946 | 0.561 | 1.817 | 43.9% | 55.0 | $314 | $296 | $267 | $58.15 | |||||||||
| 2025 Target 54.2 mpg | |||||||||||||||||||
| Cooled EGR - 1 CEGR1 50% DS 24 bar BMEP | 3.5% | 0.965 | 0.541 | 1.753 | 45.9% | 57.0 | $212 | $199 | $180 | $60.57 | |||||||||
| Cylinder Deactivation DEACD | 0.0% | 1.000 | 0.541 | 1.753 | 45.9% | 57.0 | |||||||||||||
| Cooled EGR - 2 (I-3 to I-3) CEGR2 56% DS 27 bar BMEP | 1.4% | 0.986 | 0.533 | 1.729 | 46.7% | 57.9 | $364 | $343 | $310 | $260.00 | |||||||||
| Totals | |||||||||||||||||||
| Relative to Null Vehicle | 46.7% | 0.533 | $2,315 | $2,181 | $1,983 | $49.62 | |||||||||||||
| Null Vehicle - 2008 MY Vehicle | 5.0% | 0.950 | $68 | $64 | $58 | $13.51 | |||||||||||||
| 2008 MY Vehicle - 2016 MY | 11.8% | 0.882 | $290 | $278 | $254 | ||||||||||||||
| 2017 MY- 2025 MY | 33.1% | 0.669 | $1,381 | $1,297 | $1,181 | $41.74 | |||||||||||||
| Beyond 2025 MY | 4.9% | 0.951 | $576 | $542 | $490 | $118.74 | |||||||||||||
| Credits to replace 8 sp AT: | 2.263 | -2.225 | 0.038 | ||||||||||||||||
| Credits to replace LUB2_EFR2: | 1.965 | -1.940 | 0.026 | ||||||||||||||||
| Total to be replaced with credits | 0.064 | ||||||||||||||||||
| Technology Not Required with Credits (2017 MY - 2025 MY) | $107 | $103 | $98 | ||||||||||||||||
| Reduced 2017 MY - 2025 MY Costs with Credits | $1,274 | $1,194 | $1,083 | ||||||||||||||||
| Percent Cost Savings with Credits (2017 MY - 2025 MY) | 7.7% | 7.9% | 8.3% | ||||||||||||||||
| Credits (gal/100 mi) | |||||||||||||||||||
| AC Efficiency | 0.0563 | ||||||||||||||||||
| Active Aerodynamics | 0.0068 | ||||||||||||||||||
| Stop-start (N/A w/o SS) | 0 | ||||||||||||||||||
| Total = | 0.0631 | ||||||||||||||||||
a Null vehicle: I4, DOHC, naturally aspirated, 4 valves/cylinder PFI fixed valve timing and 4 speed AT.
b An example midsize car in 2008 was 46.64 sq ft and had a fuel economy of 32.5 mpg. Its standard for MY2016 would be 36.6 mpg and for MY2025 would be 54.2 mpg.
c These technologies have transmission synergies included. Green highlighting indicates a technology order different than the NHTSA pathway, shown in Appendix S.
| Midsize Car with SI Engine Pathway with 10% MR - NRC High Most Likely Estimates - Direct Manufacturing Costs (2010$) | |||||||||||||||||||
| High Most Likely Cost Estimates Paired with Low Most Likely Effectiveness Estimates | |||||||||||||||||||
| Possible Technologies | % FC Reduction (%) | FC Reduction Multiplier | Cumulative FC Reduction Multiplier | FC (gal/100 mi) | Cumulative Percent FC Reduction | Unadjusted Combined (mpg) | 2017 Cost Estimates | 2020 Cost Estimates | 2025 Cost Estimates | 2017 Cost/Percent FC ($/%) | |||||||||
| Null Vehiclea | 1.000 | 1.000 | 3.240 | 0.0% | 30.9 | ||||||||||||||
| Intake Cam Phasing ICP | 2.6% | 0.974 | 0.974 | 3.156 | 2.6% | 31.7 | $43 | $41 | $36 | $16.54 | |||||||||
| Dual Cam Phasing DCP (vs. ICP) | 2.5% | 0.975 | 0.950 | 3.077 | 5.0% | 32.5b | $35 | $33 | $31 | $14.00 | |||||||||
| 2008 Example Vehicle | |||||||||||||||||||
| Low Rolling Resistance Tires - 1 ROLL1 | 1.9% | 0.981 | 0.932 | 3.018 | 6.8% | 33.1 | $5 | $5 | $5 | $2.63 | |||||||||
| Low Friction Lubricants - 1 LUB1 | 0.7% | 0.993 | 0.925 | 2.997 | 7.5% | 33.4 | $3 | $3 | $3 | $4.29 | |||||||||
| 6 Speed Automatic Transmissionc 6 SP AT with Improved Internals IATC | 1.3% | 0.987 | 0.913 | 2.958 | 8.7% | 33.8 | $37 | $34 | $31 | $28.46 | |||||||||
| Aero Drag Reduction - 1 AERO1 | 2.3% | 0.977 | 0.892 | 2.890 | 10.8% | 34.6 | $39 | $37 | $33 | $16.96 | |||||||||
| Engine Friction Reduction - 1 EFR1 | 2.6% | 0.974 | 0.869 | 2.815 | 13.1% | 35.5 | $48 | $48 | $48 | $18.46 | |||||||||
| Improved Accessories - 1 IACC1 | 1.2% | 0.988 | 0.858 | 2.781 | 14.2% | 36.0 | $71 | $67 | $60 | $59.17 | |||||||||
| Electric Power Steering EPS | 1.3% | 0.987 | 0.847 | 2.745 | 15.3% | 36.4 | $87 | $82 | $74 | $66.92 | |||||||||
| Mass Reduction - 2.5% MR2.5 (-87.5 lbs) | 0.8% | 0.992 | 0.841 | 2.723 | 15.9% | 36.7 | $22 | $22 | $22 | $27.50 | |||||||||
| 2016 Target 36.6 mpg | |||||||||||||||||||
| Discrete Variable Valve Lift DVVL | 3.6% | 0.964 | 0.810 | 2.625 | 19.0% | 38.1 | $133 | $125 | $114 | $36.94 | |||||||||
| Mass Reduction - 2.5%-5.0% MR5-MR2.5 (-87.5 lbs) | 0.8% | 0.992 | 0.804 | 2.604 | 19.6% | 38.4 | $66 | $66 | $66 | $82.50 | |||||||||
| Stoichiometric Gasoline Direct Injection SGDI (Required for TRBDS) | 1.5% | 0.985 | 0.792 | 2.565 | 20.8% | 39.0 | $192 | $181 | $164 | $128.00 | |||||||||
| Turbocharging & Downsizing - 1 TRBDS1 33% DS 18 bar BMEP | 7.7% | 0.923 | 0.731 | 2.368 | 26.9% | 42.2 | $331 | $312 | $282 | $42.99 | |||||||||
| Turbocharging & Downsizing - 2 TRBDS2 50% DS 24 bar BMEP | 3.2% | 0.968 | 0.707 | 2.292 | 29.3% | 43.6 | -$96 | -$92 | -$86 | -$30.00 | |||||||||
| 8 Speed Automatic Transmissionc 8 SP AT | 1.3% | 0.987 | 0.698 | 2.262 | 30.2% | 44.2 | $151 | $126 | $115 | $116.15 | |||||||||
| Shift Optimizerc SHFTOPT | 0.3% | 0.997 | 0.696 | 2.255 | 30.4% | 44.3 | $26 | $24 | $22 | $86.67 | |||||||||
| Improved Accessories - 2 IAAC2 | 2.4% | 0.976 | 0.679 | 2.201 | 32.1% | 45.4 | $43 | $40 | $37 | $17.92 | |||||||||
| Low Rolling Resistance Tires ROLL2 | 2.0% | 0.980 | 0.666 | 2.157 | 33.4% | 46.4 | $58 | $46 | $31 | $29.00 | |||||||||
| Aero Drag Reduction - 2 AERO2 | 2.5% | 0.975 | 0.649 | 2.103 | 35.1% | 47.5 | $117 | $110 | $100 | $46.80 | |||||||||
| Mass Reduction - 5%-10% MR10-MR5 (-175 lbs) | 4.6% | 0.954 | 0.619 | 2.006 | 38.1% | 49.8 | $325 | $322 | $315 | $70.65 | |||||||||
| Low Friction Lub - 2 & Engine Friction Red - 2 LUB2_EFR2 | 1.3% | 0.987 | 0.611 | 1.980 | 38.9% | 50.5 | $51 | $51 | $51 | $39.23 | |||||||||
| Cooled EGR - 1 CEGR1 50% DS 24 bar BMEP | 3.0% | 0.970 | 0.593 | 1.921 | 40.7% | 52.1 | $212 | $199 | $180 | $70.67 | |||||||||
| High Efficiency Transmissionc HEG1 & 2 | 4.9% | 0.951 | 0.564 | 1.827 | 43.6% | 54.7 | $314 | $296 | $267 | $64.08 | |||||||||
| 2025 Target 54.2 mpg | |||||||||||||||||||
| Continuously Variable Valve Lift CVVL (vs. DVVL) | 1.0% | 0.990 | 0.558 | 1.809 | 44.2% | 55.3 | $67 | $63 | $56 | $67.00 | |||||||||
| Cylinder Deactivation DEACD | 0.0% | 1.000 | 0.558 | 1.809 | 44.2% | 55.3 | |||||||||||||
| Cooled EGR - 2 CEGR2 56% DS 27 bar BMEP | 1.4% | 0.986 | 0.550 | 1.783 | 45.0% | 56.1 | $364 | $343 | $310 | $260.00 | |||||||||
| Totals | |||||||||||||||||||
| Relative to Null Vehicle | 45.0% | 0.550 | $2,744 | $2,584 | $2,367 | $61.03 | |||||||||||||
| Null Vehicle - 2008 MY Vehicle | 5.0% | 0.950 | $78 | $74 | $67 | $15.49 | |||||||||||||
| 2008 MY Vehicle - 2016 MY | 11.5% | 0.885 | $312 | $298 | $276 | $27.15 | |||||||||||||
| 2017 MY- 2025 MY | 32.9% | 0.671 | $1,923 | $1,806 | $1,658 | $58.42 | |||||||||||||
| Beyond 2025 MY | 2.4% | 0.976 | $431 | $406 | $366 | $180.64 | |||||||||||||
| Credits to replace 8 sp AT | 2.292 | -2.262 | 0.030 | ||||||||||||||||
| Credits to replace LUB2_EFR2 | 2.006 | -1.980 | 0.026 | ||||||||||||||||
| Total to be replaced with credits | 0.056 | ||||||||||||||||||
| Technology Not Required with Credits (2017 MY - 2025 MY | ) | $202 | $177 | $166 | |||||||||||||||
| Reduced 2017 MY - 2025 MY Costs with Credits | $1,721 | $1,629 | $1,492 | ||||||||||||||||
| Percent Cost Savings with Credits (2017 MY - 2025 MY) | 10.5% | 9.8% | 10.0% | ||||||||||||||||
| Credits (gal/100 mi) | |||||||||||||||||||
| AC Efficiency | 0.0563 | ||||||||||||||||||
| Active Aerodynamics | 0.0068 | ||||||||||||||||||
| Stop-start (N/A w/o SS) | 0 | ||||||||||||||||||
| Total = | 0.0631 | ||||||||||||||||||
a Null vehicle: I4, DOHC, naturally aspirated, 4 valves/cylinder PFI fixed valve timing and 4 speed AT.
b An example midsize car in 2008 was 46.64 sq ft and had a fuel economy of 32.5 mpg. Its standard for MY2016 would be 36.6 mpg and for MY2025 would be 54.2 mpg.
c These technologies have transmission synergies included. Green highlighting indicates a technology order different than the NHTSA pathway, shown in Appendix S.
| Pathway for Midsize Car with I4 Gasoline Engine | FC Reduction 2017 MY-2025 MY (%) | 2025 Direct Manufacturing Costs (2010 dollars) |
| Without Credits | 32.9 - 33.1 | 1,181 - 1,658 |
| With Credits for A/C Efficiency and Active Aerodynamics | 31.0 - 31.1 | 1,083 - 1,492 |
| Savings | 98 - 166 | |
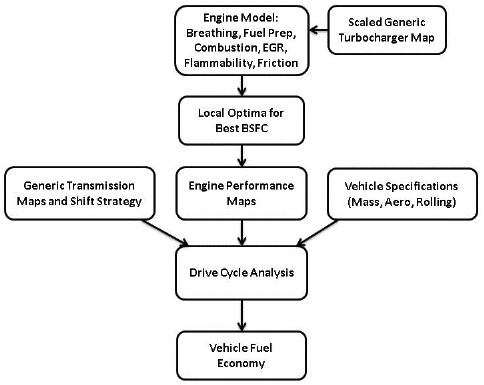
FIGURE 8.10 Schematic of engine–vehicle model.
SOURCE: Middleton et al. (2015).
deceleration fuel shut-off, and minimum time in gear and shift execution might yield fuel economy improvements for the eight-speed transmission. Scherer et al. (2009) described a new eight-speed transmission design with significant friction reductions. The effects of such reductions are simulated in Tasks 9B through 9E, where arbitrary levels of friction reduction up to 60 percent are introduced. Approximately 1.8 to 1.9 percent fuel consumption reductions were shown for each 15 percent reduction in losses. The introduction of the CVT with losses representative of current production CVTs in Task 10-A showed fuel economy comparable to the 6 AT in Task 8. Analysis showed a significant tightening of the visitation points on the engine map toward the optimal region; however, this effect was apparently not enough to compensate for the CVT’s higher losses compared to the six-speed automatic transmission. To examine this effect further, the CVT loss map was replaced with the loss map of the eight -speed automatic transmission and rerun as Task 10-B. The result showed only a minor improvement in fuel economy, since moderate speed and load losses were not improved significantly.
Comparison with NHTSA RIA Estimates and EPA Lumped Parameter Model
The results from the U of M full system simulation are compared with NHTSA’s estimates in the RIA and estimates provided by EPA’s lumped parameter model in Table 8.11. The incremental fuel consumption reductions are similar for all three estimation methods, although some differences appear for individual technologies. However, the U of M full system simulation shows significantly lower improvements for the eight-speed automatic transmission and the high-efficiency gear box, with a 30 percent reduction in losses relative to the other two estimation methods. As suggested in Chapter 5, NHTSA should investigate the benefits of trans-
TABLE 8.10 Detailed Fuel Economy Results from the U of M Full System Simulation Study
| Task | Engine | Trans | FTP (mpg) | HWY (mpg) | Combined (mpg) | Fuel Consumption (FC) (gal/100) | Incr. Fuel Consumption Change (%) | Cumul. Fuel Consumption change (%) | |||||||||||
| Disp (L) | Air | Fuel | Fric | Cams | |||||||||||||||
| Fixed | DCP | DVVL | CEGR | ||||||||||||||||
| 1 | 2 | TC | GDI | ---- | Model validation engine | ||||||||||||||
| 2 | 2.5 | NA | PFI | Fixed | 6 AT | 22.9 | 40.4 | 28.4 | 3.52 | Engine reconfigured to 2.5L NA | |||||||||
| 3 | 2.5 | NA | PFI | DCP | 6 AT | 26.2 | 42.9 | 31.8 | 3.15 | 2012 Ford Fusion simulation | |||||||||
| 4 | 2.5 | NA | PFI | EFR-LUB | DCP | 6 AT | 27.5 | 44.5 | 33.2 | 3.01 | -4.4 | -4.4 | |||||||
| 5 | 2.5 | NA | PFI | EFR-LUB | DCP | DVVL | 6 AT | 29.3 | 46.7 | 35.2 | 2.84 | -5.7 | -9.8 | ||||||
| 6 | 2.5 | NA | GDI | EFR-LUB | DCP | DVVL | 6 AT | 29.7 | 47.0 | 35.6 | 2.81 | -1.1 | -10.8 | ||||||
| 7 | 1.68 | TC | GDI | EFR-LUB | DCP | DVVL | 6 AT | 33.3 | 50.7 | 39.4 | 2.54 | -9.6 | -19.4 | ||||||
| 8 | 1.25 | TC | GDI | EFR-LUB | DCP | DVVL | CEGR | 6 AT | 35.1 | 52.7 | 41.3 | 2.42 | -4.6 | -23.0 | |||||
| 9-A | 1.25 | TC | GDI | EFR-LUB | DCP | DVVL | CEGR | 8 AT | 34.7 | 53.1 | 41.1 | 2.43 | 0.4 | -22.8 | |||||
| 9-Ba | 1.25 | TC | GDI | EFR-LUB | DCP | DVVL | CEGR | 8AT | 35.4 | 54.2 | 41.9 | 2.39 | -1.9 | -24.2 | |||||
| -15% | |||||||||||||||||||
| 9-Ca | 1.25 | TC | GDI | EFR-LUB | DCP | DVVL | CEGR | 8AT -30% | 36.0 | 55.4 | 42.8 | 2.34 | -1.9 | -25.7 | |||||
| 9-Da | 1.25 | TC | GDI | EFR-LUB | DCP | DVVL | CEGR | 8AT -45% | 36.7 | 56.4 | 43.5 | 2.30 | -1.8 | -27.0 | |||||
| 9-Ea | 1.25 | TC | GDI | EFR-LUB | DCP | DVVL | CEGR | 8AT -60% | 37.3 | 57.4 | 44.3 | 2.26 | -1.8 | -28.3 | |||||
| 10-Ab | 1.25 | TC | GDI | EFR-LUB | DCP | DVVL | CEGR | CVT | 35.5 | 52.6 | 41.6 | 2.41 | 6.6 | -23.6 | |||||
| 10-Bb | 1.25 | TC | GDI | EFR-LUB | DCP | DVVL | CEGR | CVT | 35.6 | 52.8 | 41.8 | 2.40 | -0.4 | -23.9 | |||||
a Tasks 9-B – 9-E have reduced transmission torque losses relative to the 6 AT and 8 AT transmissions in Tasks 8 and 9-A, as indicated by the percentage in the table under Trans.
b Task 10-B is the same as Task 10-A except that CVT-2 uses the more efficient loss map of the 6 AT automatic transmissions.
SOURCE: Middleton et al. (2015).
| Technology | U of M Full System Simulation | From NHTSA RIA Table V-126 | From Lumped Parameter Model | ||||||||||||||||
| U of Ma FSS Results Incremental % FC Reduction | U of M FSS Results Incremental % FC Reduction | U of M FSS Results Cumulative % FC Reduction | NHTSA RIA Incremental % FC Reduction | NHTSA RIA Incremental % FC Reduction | NHTSA RIA Cumulative % FC Reduction | EPA LPM Incremental % FC Reduction | EPA LPM Incremental % FC Reduction | EPA LPM Cumulative % FC Reduction | Adjusted EPA LPM Cumulative % FC Reduction | ||||||||||
| DCP and 6AT-IATC | Baseline | 1.000 | 0 | 0.0 | 0.929 | 7.1 | 0.0 | ||||||||||||
| LUB1 | 0.7 | 0.993 | 0.5 | 0.995 | 7.6 | 0.5 | |||||||||||||
| EFR1 | 2.6 | 0.974 | 1.8 | 0.982 | 9.3 | 2.4 | |||||||||||||
| EFR2 | 1.3 | 0.987 | 1.4 | 0.986 | 10.6 | 3.8 | |||||||||||||
| LUB and EFR | 4.4 | 0.956 | 4.4 | 4.5 | 0.955 | 4.5 | 3.8 | 0.962 | |||||||||||
| DVVL | 5.7 | 0.943 | 9.8 | 4.6 | 0.954 | 8.9 | 2.2 | 0.978 | 12.6 | 5.9 | |||||||||
| SGDI | 1.1 | 0.989 | 10.8 | 1.5 | 0.985 | 10.3 | 1.5 | 0.985 | 13.9 | 7.3 | |||||||||
| TRBDS1 | 9.6 | 0.904 | 19.4 | 8.3 | 0.917 | 17.7 | 6.4 | 0.936 | 19.4 | 13.2 | |||||||||
| TRBDS2 | 3.5 | 0.965 | 2.6 | 0.974 | 21.5 | 15.5 | |||||||||||||
| CEGR1 | 3.5 | 0.965 | 3.6 | 0.964 | 24.3 | 18.5 | |||||||||||||
| TRBDS2 and CEGR1 | 4.6 | 0.954 | 23.0 | 6.9 | 0.931 | 23.4 | 6.1 | 0.939 | |||||||||||
| 8 AT | -0.4 | 1.004 | 3.9 | 0.961 | 26.4b | 3.7 | 0.963 | 27.1 | 21.5 | ||||||||||
| 8 AT-HETRANSa | 3.8 | 0.962 | 25.7 | 2.7 | 0.973 | 28.4b | 4.0 | 0.960 | 30.0 | 24.7 | |||||||||
| Summary for Turbocharged Downsized Engines | |||||||||||||||||||
| SGDI | 0.989 | 0.987 | 0.985 | ||||||||||||||||
| TRBDS1 | 0.904 | 0.917 | 0.936 | ||||||||||||||||
| TRBDS2 and CEGR2 | 0.954 | 0.931 | 0.939 | ||||||||||||||||
| 0.853 | 14.7% | 0.843 | 15.7% | 0.866 | 13.4% | ||||||||||||||
a30% loss reduction.
bSynergies applied.
missions with an additional number of gears when applied to advanced SI engines that already have significantly reduced pumping and friction losses.
Agencies’ Full System Simulation Programs
Recently, EPA and NHTSA initiated full system simulation programs. These simulation programs will enhance the Agencies’ capability for analyzing fuel consumption reduction technologies and are in response to the recommendation of the Phase 1 NRC study (2011). The Advanced Light-Duty Powertrain and Hybrid Analysis (ALPHA) tool was created by EPA to evaluate the GHG emissions and fuel efficiency of light-duty vehicles (Lee et al. 2013). NHTSA is investigating simulating all technology combinations for all vehicle classes using the Autonomie vehicle simulation model developed by Argonne National Laboratories (NHTSA 2014). Autonomie deployment and support are now handled by LMS International. Engine maps will be developed in GT-Power by IAV. NHTSA anticipates that this simulation model will replace the synergy factors described earlier in this chapter.
IMPLEMENTATION STATUS OF FUEL CONSUMPTION REDUCTION TECHNOLOGIES
Fuel Consumption Reductions from EPA Certification Data Compared to NHTSA Estimates
Some of the engine, transmission, and vehicle technologies anticipated by EPA and NHTSA for the 2017 to 2025 MY CAFE targets have already been introduced in production vehicles. Vehicles with these technologies provided an opportunity for the committee to examine the status of fuel consumption reductions achieved by current 2014 MY vehicles. The committee analyzed the fuel consumption reductions achieved by several vehicles, based on EPA certification test data, and compared the results to the NHTSA-estimated fuel consumption reductions. NHTSA estimated fuel consumption reductions for the vehicles by applying its estimated fuel consumption reductions for each of the technologies that had been applied to four high volume midsize cars. The baseline for this comparison used the 2008 MY vehicles for two reasons. First, NHTSA used the 2008 MY as a baseline in the TSD (EPA/NHTSA 2012a). Second, the vehicles that were reviewed, which are listed in Table 8.12, approximated, with minor exceptions, the NHTSA null vehicle configuration consisting of a naturally aspirated engine, port fuel injection, fixed valve timing and lift, and a four- or five-speed automatic transmission. The engine technologies included in the 2014 MY vehicles were determined from the 2014 EPA Fuel Economy Datafile. However, the vehicles’ fuel consumption reduction technologies were less well defined.
The results from comparing the 2014 MY vehicles to the 2008 MY baseline vehicles are shown in Table 8.12, and they indicate that the actual fuel consumption reductions based on EPA certification test data meet, and in some cases exceed, the aggregation of NHTSA technology effectiveness estimates. During this time frame, a combination of engine, transmission, and vehicle technologies have been applied to these vehicles, providing fuel consumption reductions ranging from 14 percent to 21 percent. Since these technologies have already been applied to the 2014 MY vehicles shown in the table in order to comply with the current CAFE standards, they will be included in the baseline vehicles for the beginning of the 2017 to 2025 MY CAFE standards.
Table 8.12 uses EPA uncorrected FTP75 and HWFET combined fuel economy data that are used for CAFE compliance and are obtained from the EPA Fuel Economy Datafile. The left-hand group of columns in the table, which lists the technologies generally available in the 2008-2014 MY time frame, is shown for reference. Not all of these technologies were utilized by all of the example vehicles listed since the OEMs were able to meet their overall 2014 MY CAFE targets without incorporating all of them.
EPA Certification Fuel Economy Compared to CAFE Targets
The fuel economy values of selected vehicles of interest, which have already incorporated some of the technologies identified by NHTSA, were compared to the current and future CAFE targets. The EPA certification fuel economy values for these vehicles (two-cycle CAFE certification test, see Chapter 10) together with other pertinent characteristics, including the fuel economy improvement technologies and footprint, are provided in Appendix W, Tables W.1 and 2. For reference, the label fuel economy values (five-cycle CAFE label test, see Chapter 10) are also provided for comparison with the two-cycle CAFE fuel economy values. Similar information for several hybrid vehicles is also provided in Appendix W, Table W.3.
The CAFE fuel economy values of these vehicles are plotted on the NHTSA fuel economy target curves for the 2012 MY through 2025 MY shown in Figure 8.11 for cars and Figure 8.12 for light trucks. The fuel economy values cluster around the 2016 MY targets and between the 2019 MY and 2021 MY targets. In particular, the fuel economy values of several cars with SI engines are notably above the 2016 MY targets. This includes a vehicle with turbocharging and downsizing; one with variable valve lift and a CVT transmission; one with Multi-Air variable valve timing and lift and a DCT transmission; and one with a three-cylinder naturally aspirated engine and a CVT transmission. The vehicle with the three-cylinder engine with a CVT currently has the highest EPA fuel economy for the 2015 MY. Notable on this figure is the BMW 740Li. This vehicle incorporates many of the technologies used for improving fuel economy in a high-performance vehicle. This example illustrates that implementing these technologies may provide incremental improvements but does not ensure that high fuel economy will be achieved.
| Actual EPA Fuel Consumption Reductions Compared to Aggregation of NHTSA Technology Effectiveness Estimates Example Vehicles from EPA Fuel Economy Guide | |||||||||||||||||||
| Baseline Vehicle | Ford Fusion | Chevrolet Malib | u | Toyota Camry | Honda Accord | ||||||||||||||
| NA, 4 valves/cyl Fixed valve timing AT-4 | 2.3L I4 NA ICP - VVT AT-5 | 2.4L I4 NA DCP - VVT AT-4 | 2.4L NA ICP - VVT AT-5 | 2.4L NA ICP - VVT I-VTEC (DVVL) AT-5 | |||||||||||||||
| Possible Technologies | NHTSA % FC Reductions | EPA Data | NHTSA Estimates | EPA Data | NHTSA Estimates | EPA Data | NHTSA Estimates | EPA Data | NHTSA Estimates | ||||||||||
| 2008 MY EPA Combined FE (uncorrected) | 30.57 | Base | 32.48 | Base | 32.89 | Base | 31.6 | Base | |||||||||||
| LUB1 | 0.7 | 0.993 | X | 0.993 | X | 0.993 | X | 0.993 | |||||||||||
| 5W-20 GF5 | 5W-30 | 0W-20 | 0W-20 | ||||||||||||||||
| ROLL1 | 1.9 | 0.981 | Assumed | 0.981 | Assumed | 0.981 | Assumed | 0.981 | Assumed | 0.981 | |||||||||
| EFR1 | 2.6 | 0.974 | 50% Assumed | 0.987 | 50% Assumed | 0.987 | 50% Assumed | 0.987 | 50% Assumed | 0.987 | |||||||||
| EPS | 1.3 | 0.987 | X | 0.987 | X | 0.987 | X | 0.987 | X | 0.987 | |||||||||
| IACC1 | 1.22 | 0.988 | 50% Assumed | 0.994 | 50% Assumed | 0.994 | 50% Assumed | 0.994 | 50% Assumed | 0.994 | |||||||||
| 6 SP AT | 2.04 | 0.980 | X | 0.980 | X | 0.980 | X | 0.980 | X | 0.934 | |||||||||
| (CVT - Assumed = 8 spd) | |||||||||||||||||||
| ICP | 2.62 | 0.974 | |||||||||||||||||
| DCP | 2.47 | 0.975 | X | 0.975 | X | 0.975 | X | 0.975 | |||||||||||
| Sub-Total | 13.9% | 0.861 | |||||||||||||||||
| DVVL | 3.64 | 0.964 | X | 0.964 | |||||||||||||||
| SGDI | 1.5 | 0.985 | X | 0.985 | X | 0.985 | MFI | X | 0.985 | ||||||||||
| TRBDS1 | 7.49 | 0.925 | X | 0.925 | |||||||||||||||
| 33% | |||||||||||||||||||
| AERO1 | 2.3 | 0.977 | Assumed | 0.977 | Assumed | 0.977 | Assumed | 0.977 | Assumed | 0.977 | |||||||||
| SS | 2.1 | 0.979 | X | 0.979 | X | 0.979 | |||||||||||||
| Ford Fusion | Chevrolet Malibu | Toyota Camry | Honda Accord | ||||||||||||||||
| 1.5L TC | 2.5L NA | 2.5L NA | 2.4L NA | ||||||||||||||||
| I & E VVT | I & E VVT | I & E VVT | I & E VVT | ||||||||||||||||
| AT-6 | AT-6 | AT-6 | CVT | ||||||||||||||||
| GDI | GDI | MFI | GDI | ||||||||||||||||
| SS | DVVL | DVVL | |||||||||||||||||
| 0.7228 | 2014 MY EPA Combined FE (uncorrected) | 38.92 | 0.785 | 39.00 | 0.845 | 38.19 | 0.880 | 40.22 | 0.827 | ||||||||||
| Total- Possible Technologies | -27.7% | FC Reduction % | -21.5% | -21.5% | -16.7% | -15.5% | -13.9% | -12.0% | -21.4% | -17.3% | |||||||||
| Differences: EPA data vs. calculation using NHTSA estimates | 0.0% | 1.2% | 1.9% | 4.1% | |||||||||||||||
SOURCE: EPA (2008, 2014); EPA/NHTSA (2012b); Ford Parts; GM Parts; Toyota Parts; Honda Parts.
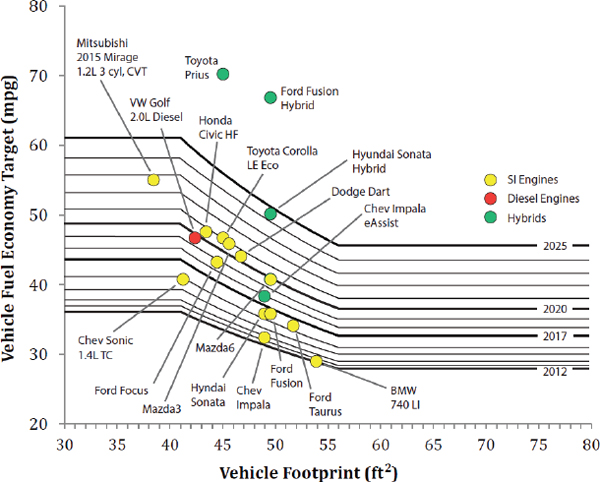
FIGURE 8.11 Fuel economy values of 2013 and 2014 MY cars incorporating many CAFE technologies plotted on NHTSA CAFE target curves.
SOURCE: EPA/NHTSA (2012b); EPA (2008, 2014); Cars.com.
The CAFE fuel economy values of several hybrid vehicles are also plotted on Figure 8.11. The hybrid vehicles are outliers on this plot since they achieve fuel economy values well above their conventional SI engine counterparts. The high levels of fuel economy for hybrid vehicles illustrates why many OEMs are pursuing hybrid technology as part of a broad CAFE/GHG compliance plan. The fuel economy values of two examples of 2014 MY powersplit hybrid vehicles currently exceed the 2025 MY targets, while the fuel economy of an example of a 2014 MY P2 hybrid closely approaches the 2025 MY targets. This figure illustrates the potential for a manufacturer to use hybrid powertrains to offset vehicles with conventional SI engines with fewer fuel consumption reduction technologies than might be required without the offsetting hybrid vehicles.
The CAFE fuel economy values for the pickup trucks cluster around the 2016-2017 targets with two exceptions. The Ram pickup truck with a 3.0L diesel engine shows a 19 percent improvement in fuel economy over a similar truck with a V6 gasoline engine. The 2015 F150 pickup truck with an aluminum body with a reported 700 lb weight reduction and a nearly 50 percent downsized and turbocharged V6 engine also shows a 19 percent improvement over a similar truck with a V6 turbocharged engine. As shown in Appendix W, Table W.2, the 22 mpg combined fuel economy label for the aluminum F150 is within 1 mpg of the 23 mpg combined fuel economy label of the Ram diesel pickup truck. Lower fuel costs for gasoline compared to diesel could eliminate the operating cost differences between these vehicles and possibly favor the gasoline engine, depending on relative fuel cost differences.
Finding 8.1 (Partitioning technologies by time frame) EPA and NHTSA have defined many technologies with the potential to reduce fuel consumption. Costs and benefits of the CAFE final rule were assessed from a baseline fleet of vehicle makes and models as they existed in 2008 and in 2010. To assemble this baseline fleet, technologies were
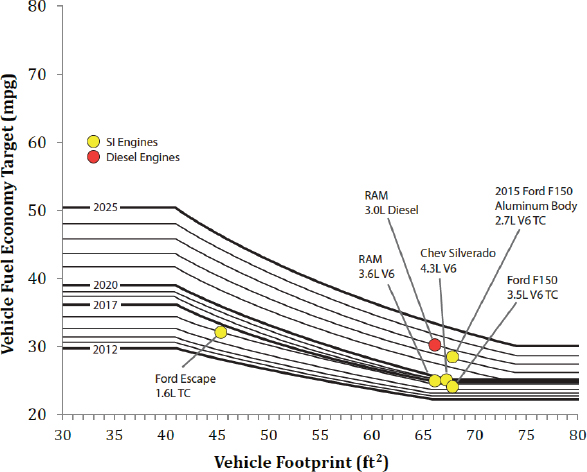
FIGURE 8.12 Fuel economy values of 2013, 2014, and 2015 MY trucks incorporating many CAFE technologies plotted on NHTSA CAFE target curves.
SOURCE: EPA/NHTSA (2012b); EPA (2008, 2014); Cars.com
added to a “null” vehicle, defined as one having an engine with four valves per cylinder, fixed valve timing and lift, port fuel injection, and a four-speed automatic transmission. In EPA’s and NHTSA’s compliance models, technologies were added to baseline fleet vehicles to reach compliance with the fleet average, footprint-based standards. This was done for the 2012-2016 MY standards, and then, using the modeled compliance paths to 2016, new technologies were added to further comply with the 2017-2025 standards. EPA and NHTSA used different compliance models with slightly different baseline fleets.
Recommendation 8.1 (Define new 2016 null vehicle) The committee compliments EPA and NHTSA on their plans to determine the actual technology penetration rates for the 2016 MY fleet, as data becomes available. The committee recommends the Agencies establish a new definition of a “null” vehicle, representative of the most basic vehicle in the 2016 MY time frame as well as a baseline 2016 MY fleet reflecting actual technology penetration rates. The vehicles in the 2016 MY fleet should be assigned EPA certification fuel economy values and reasons for any differences between actual and estimated effectiveness of the technologies applied to the 2008 MY vehicles, derived from the original null vehicle, should be determined. This updated baseline should consider changes in performance of these 2016 MY vehicles relative to the 2008 MY vehicles when estimating the effectiveness of the technologies applied to the 2016 MY vehicles. Updated null vehicles with technologies applied for the 2016 MY will assist in distinguishing between technologies that can be applied for the 2017 to 2025 MY CAFE targets from technologies that have already been applied to achieve the 2016 MY CAFE targets.
Finding 8.2 (Effectiveness) The committee’s most likely estimates of fuel consumption reduction effectiveness are comparable to NHTSA’s estimates for many of the technologies defined by NHTSA. However, the committee estimated higher most likely effectiveness values for several technologies, including mass reduction and high-efficiency
gearbox technology. For some other technologies, including several of the turbocharged, downsized engine technologies and P2 hybrids, the committee extended the range of most likely estimates of effectiveness to include lower values. For several other technologies, including eight-speed automatic transmissions and shift optimization, the committee’s low and high ranges of most likely estimates were lower than NHTSA’s estimates.
Finding 8.3 (Costs) The committee’s estimates of direct manufacturing costs are comparable to NHTSA’s estimates for some of the technologies defined by NHTSA. The committee extended the range to include higher estimates of direct manufacturing costs for some technologies, including several SI engine technologies, several transmission technologies, and electrified powertrain technologies. The ranges of most likely direct manufacturing costs for several other technologies, including diesel engines, several transmission technologies, and mass reduction, were estimated to be higher than NHTSA’s estimates.
Recommendation 8.2 (Updating cost and effectiveness) While the committee concurred with the Agencies’ costs and effectiveness values for a wide array of technologies, in some cases the committee developed estimates that significantly differed from the Agencies’ values, so the committee recommends that the Agencies pay particular attention to the reanalysis of these technologies in the mid-term review.
Finding 8.4 (Cost effectiveness) The cost effectiveness of individual technologies defined as the cost per percent fuel consumption reduction for the technologies for SI engine, transmission, and vehicle technologies ranges from less than $25 to significantly over $100 per percent fuel consumption reduction. The cost effectiveness of a spark ignition engine with all of NHTSA’s technologies included is less than $50 per percent reduction in fuel consumption, which is lower than advanced diesel engines and strong hybrids, which are in the range of $75 to $100 per percent reduction in fuel consumption.
Finding 8.5 (Effectiveness depends on the prior technologies) Some of the technologies defined by NHTSA have already been incorporated in current vehicles, and additional technologies are expected to be applied to achieve the 2016 MY CAFE targets. By the 2016 MY, many vehicles will include variable valve timing and lift, stoichiometric gasoline direct injection, six- or eight-speed automatic transmissions, and some will have turbocharged, downsized engines at level 1 with 18 bar BMEP or higher. Although these technologies are included in the complete list of NHTSA’s technologies relative to the baseline null vehicle that approximates a vehicle prior to the 2008 MY, only the additional technologies beyond those applied by the 2016 MY will be available in the 2017-2025 time frame and beyond to provide additional reductions in fuel consumption. The effectiveness of a technology depends on the technologies that have already been applied to a vehicle. For example, although the relative effectiveness of a turbocharged, downsized engine at level 1 was estimated by NHTSA to provide 12.9 to 14.9 percent reduction in fuel consumption relative to the null vehicle, the effectiveness of this technology is reduced to 7.7 to 8.3 percent when applied to a vehicle already having friction reduction, variable valve timing and lift, and stoichiometric gasoline direct injection technologies.
Finding 8.6 (Other technologies) In addition to the technologies defined by NHTSA, the committee has identified other technologies that might be available by the 2025 MY that could provide additional reductions in fuel consumption or provide alternative approaches at lower cost. In addition, the committee has identified several technologies that might be available after the 2025 MY, although these technologies are generally still in the research phase of development. As discussed in Chapter 2, alternative fuels combined with SI technologies (e.g., flex-fuel vehicles, ethanol-boosted direct injection systems) also may provide some opportunity for petroleum reductions. For each of the technologies listed in the Alternative Fuels section of Table 8A.1, energy consumption reduction (as gasoline gallons equivalent, gge) is shown, followed by the CAFE petroleum reduction in brackets. The application of indirect credits for air conditioning efficiency together with active aerodynamics and stop-start off-cycle credits provide opportunities for cost savings in achieving the CAFE targets.
Finding 8.7 (Full system simulation) Full system simulations provide estimates of effectiveness of technologies applied either singularly or in combination with other technologies, as in the case of applying multiple technologies to achieve future CAFE targets. Full system simulations can provide these estimates before experimental test data are available. The committee contracted with the University of Michigan to develop a full system simulation, which confirmed the effectiveness trends provided by the EPA lumped parameter model and incorporated in NHTSA’s decision tree paths together with their synergy tables. For projections of technologies without test data, full system simulations must include detailed models that are correlated to baseline hardware with available test data. The correlation of models ensures that the results will reflect only the effectiveness of the technology of interest.
Recommendation 8.3 (Full system simulation and teardown cost analysis) The committee notes that the use of full vehicle simulation modeling in combination with lumped parameter modeling and teardown studies contributed substantially to the value of the Agencies’ estimates of fuel consumption and costs, and it therefore recommends they continue to increase the use of these methods to improve
their analysis. The committee recognizes that such methods are expensive but believes that the added cost is well justified because it produces more reliable assessments.
EPA (Environmental Protection Agency). 2008. Fuel Economy Data Files. http://www.fueleconomy.gov/feg/download.shtml.
EPA. 2012. Regulatory Impact Analysis: Final Rulemaking for 2017-2025 Light-Duty Vehicle Greenhouse Gas Emission Standards and Corporate Average Fuel Economy Standards. EPA-420-R-12-016, August.
EPA. 2014. Fuel Economy Data Files. http://www.fueleconomy.gov/feg/download.shtml.
EPA/NHTSA (National Highway Traffic Safety Administration). 2009. Draft Joint Technical Support Document: Proposed Rulemaking to Establish Light-Duty Vehicle Greenhouse Gas Emission Standards and Corporate Average Fuel Economy Standards. EPA-420-D-09-901, September.
EPA/NHTSA. 2012a. Joint Technical Support Document, Final Rulemaking 2017-2025 Light-Duty Greenhouse Gas Emission Standards and Corporate Average Fuel Economy Standards. EPA-420-R-12-901, August.
EPA/NHTSA. 2012b. 2017 and Later Model Year Light-Duty Vehicle Greenhouse Gas Emissions and Corporate Average Fuel Economy Standards. EPA 40 CFR Parts 85, 86 and 600, NHTSA 49 CFR Parts 523, 531, 533, 536 and 537, August 28.
Gamma Technologies. n.d. GT-POWER Engine Simulation Software: Engine Performance Analysis Modeling. http://www.gtisoft.com/upload/Power.pdf.
Goodman, L.A. 1962. The variance of the product of K random variables. Journal of the American Statistical Association. 57(297).
Heard, D.C. 1987. A Simple Formula for Calculation the Variance of Products and Dividends. Department of Renewable Resources, Government of the NWT, Yellowknife, NWT.
Lee, B., S. Lee, J. Cherry, A. Neam, J. Sanchez, and E. Nam. 2013. Development of Advanced Light-Duty Powertrain and Hybrid Analysis Tool. SAE Technical Paper 2013-01-0808. doi: 10.4271/2013-01-0808.
Middleton, R., O. Gupta, H-Y Chang, G.A. Lavoie, and J. Martz. 2015. Fuel Economy Estimates for Future Light Duty Vehicles. University of Michigan Report. Ann Arbor, Michigan.
NHTSA. 2012. Final Regulatory Impact Analysis: Corporate Average Fuel Economy for MY 2017-MY2025 Passenger Cars and Light Trucks. Office of Regulatory Analysis and Evaluation, National Center for Statistics and Analysis.
NHTSA. 2014. NHTSA’s Recent Activities on Light-Duty Fuel Economy. Presentation to the National Research Council Committee on Assessment of Technologies for Improving Fuel Economy of Light Duty Vehicles, Phase 2, June 23.
NRC (National Research Council). 2002. Effectiveness and Impact of Corporate Average Fuel Economy (CAFE) Standards. Washington, D.C.: The National Academies Press.
NRC. 2011. Assessment of Fuel Economy Technologies for Light-Duty Vehicles. Washington, D.C.: The National Academies Press.
Olechiw, M. 2014. Baseline Vehicles. Email communication to the committee, June 27.
Ricardo, Inc. 2011. Draft Project Report: Computer Simulation of Light-Duty Vehicle Technologies for Greenhouse Gas Emission Reduction in the 2020-2025 Timeframe. Report to EPA Office of Transportation and Air Quality, EP-W0-07-064, Ann Arbor, Michigan, April 6.
Robinette, D. 2014. A DFSS Approach to determine automatic transmission gearing content for powertrain-vehicle system integration. SAE Int. J. Passeng. Cars - Mech. Syst. 7(3): 1138-1154. doi:10.4271/2014-01-1774.
Scherer, H., M. Bek, and S. Kilian. 2009. ZF New 8-speed Automatic Transmission 8HP70 - Basic design and hybridization. SAE Int. J. Engines 2(1): 314-326. doi:10.4271/2009-01-0510.
TABLE 8A.1 NRC Committee’s Estimated Fuel Consumption Reduction Effectiveness of Technologies
| Percent Incremental Fuel Consumption Reductions: NRC Estimates | |||||||||||||||||||
| Midsize Car I4 DOHC | Large Car V6 DOHC | Large Light Truck V8 OHV | |||||||||||||||||
| Spark Ignition Engine Technologies | Abbreviation | Most Likely | Most Likely | Most Likely | Relative To | ||||||||||||||
| NHTSA Technologies | |||||||||||||||||||
| Low Friction Lubricants - Level 1 | LUB1 | 0.7 | 0.8 | 0.7 | Baseline | ||||||||||||||
| Engine Friction Reduction - Level 1 | EFR1 | 2.6 | 2.7 | 2.4 | Baseline | ||||||||||||||
| Low Friction Lubricants and Engine Friction Reduction - Level 2 | LUB2_EFR2 | 1.3 | 1.4 | 1.2 | Previous Tech | ||||||||||||||
| VVT- Intake Cam Phasing (CCP - Coupled Cam Phasing - OHV) | ICP | 2.6 | 2.7 | 2.5 | Baseline for DOHC | ||||||||||||||
| VVT- Dual Cam Phasing | DCP | 2.5 | 2.7 | 2.4 | Previous Tech | ||||||||||||||
| Discrete Variable Valve Lift | DVVL | 3.6 | 3.9 | 3.4 | Previous Tech | ||||||||||||||
| Continuously Variable Valve Lift | CVVL | 1.0 | 1.0 | 0.9 | Previous Tech | ||||||||||||||
| Cylinder Deactivation | DEACD | N/A | 0.7 | 5.5 | Previous Tech | ||||||||||||||
| Variable Valve Actuation (CCP + DVVL) | VVA | N/A | N/A | 3.2 | Baseline for OHV | ||||||||||||||
| Stoichiometric Gasoline Direct Injection | SGDI | 1.5 | 1.5 | 1.5 | Previous Tech | ||||||||||||||
| Turbocharging and Downsizing Level 1 - 18 bar BMEP 33%DS | TRBDS1 | 7.7 - 8.3 | 7.3 - 7.8 | 6.8 - 7.3 | Previous Tech | ||||||||||||||
| Turbocharging and Downsizing Level 2 - 24 bar BMEP 50%DS | TRBDS2 | 3.2 - 3.5 | 3.3 - 3.7 | 3.1 - 3.4 | Previous Tech | ||||||||||||||
| Cooled EGR Level 1 - 24 bar BMEP, 50% DS | CEGR1 | 3.0 - 3.5 | 3.1 - 3.5 | 3.1 - 3.6 | Previous Tech | ||||||||||||||
| Cooled EGR Level 2 - 27 bar BMEP, 56% DS | CEGR2 | 1.4 | 1.4 | 1.2 | Previous Tech | ||||||||||||||
| Other Technologies | |||||||||||||||||||
| By 2025: | |||||||||||||||||||
| Compression Ratio Increase (with regular fuel) | CRI-REG | 3.0 | 3.0 | 3.0 | Baseline | ||||||||||||||
| Compression Ratio Increase (with higher octane regular fuel) | CRI-HO | 5.0 | 5.0 | 5.0 | Baseline | ||||||||||||||
| Compression Ratio Increase (CR~13:1, exh. scavenging, DI (aka Skyactiv, Atkinson Cycle)) | CRI-EXS | 10.0 | 10.0 | 10.0 | Baseline | ||||||||||||||
| Electrically Assisted Variable Speed Superchargera | EAVS-SC | 26.0 | 26.0 | 26.0 | Baseline | ||||||||||||||
| Lean Burn (with low sulfur fuel) | LBRN | 5.0 | 5.0 | 5.0 | Baseline | ||||||||||||||
| After 2025: | |||||||||||||||||||
| Variable Compression Ratio | VCR | Up to 5.0 | Up to 5.0 | Up to 5.0 | Baseline | ||||||||||||||
| D-EGR | DEGR | 10.0 | 10.0 | 10.0 | TRBDS1 | ||||||||||||||
| Homogeneous Charge Compression Ignition (HCCI) + Spark Assisted CIb | SA-HCCI | Up to 5.0 | Up to 5.0 | Up to 5.0 | TRBDS1 | ||||||||||||||
| Gasoline Direct Injection Compression Ignition (GDCI) | GDCI | Up to 5.0 | Up to 5.0 | Up to 5.0 | TRBDS1 | ||||||||||||||
| Waste Heat Recovery | WHR | Up to 3.0 | Up to 3.0 | Up to 3.0 | Baseline | ||||||||||||||
| Alternative Fuelsc: | |||||||||||||||||||
| CNG-Gasoline Bi-Fuel Vehicle (default UF = 0.5) | BCNG | Up to 5 Incr [42] | Up to 5 Incr [42] | Up to 5 Incr [42] | Baseline | ||||||||||||||
| Flexible Fuel Vehicle (UF dependent, UF = 0.5 thru 2019) | FFV | 0 [40 thru 2019, then UF TBD] | 0 [40 thru 2019, then UF TBD] | 0 [40 thru 2019, then UF TBD] | Baseline | ||||||||||||||
| Ethanol Boosted Direct Injection (CR = 14:1, 43% downsizing) (UF~0.05) | EBDI | 20 [24] | 20 [24] | 20 [24] | Baseline | ||||||||||||||
| Percent Incremental Fuel Consumption Reductions: NRC Estimates | |||||||||||||||||||
| Midsize Car I4 DOHC | Large Car V6 DOHC | Large Light Truck V8 OHV | |||||||||||||||||
| Diesel Engine Technologies | Abbreviation | Most Likely | Most Likely | Most Likely | Relative To | ||||||||||||||
| NHTSA Technologies | |||||||||||||||||||
| Advanced Diesel | ADSL | 29.4 | 30.5 | 29.0 | Baseline | ||||||||||||||
| Other Technologies | |||||||||||||||||||
| Low Pressure EGR | LPEGR | 3.5 | 3.5 | 3.5 | ADSL | ||||||||||||||
| Closed Loop Combustion Control | CLCC | 2.5 | 2.5 | 2.5 | ADSL | ||||||||||||||
| Injection Pressures Increased to 2,500 to 3,000 bar | INJ | 2.5 | 2.5 | 2.5 | ADSL | ||||||||||||||
| Downspeeding with Increased Boost Pressure | DS | 2.5 | 2.5 | 2.5 | ADSL | ||||||||||||||
| Friction Reduction | FR | 2.5 | 2.5 | 2.5 | ADSL | ||||||||||||||
| Waste Heat Recovery | WHR | 2.5 | 2.5 | 2.5 | ADSL | ||||||||||||||
| Transmission Technologies | Abbreviation | Most Likely | Most Likely | Most Likely | Relative To | ||||||||||||||
| NHTSA Technologies | |||||||||||||||||||
| Improved Auto. Trans. Controls/Externals (ASL-1 & Early TC Lockup) | IATC | 2.5 - 3.0 | 2.5 - 3.0 | 2.5 - 3.0 | 4 sp AT | ||||||||||||||
| 6-speed AT with Improved Internals - Lepelletier (Rel to 4 sp AT) | NUATO-L | 2.0 - 2.5 | 2.0 - 2.5 | 2.0 - 2.5 | IATC | ||||||||||||||
| 6-speed AT with Improved Internals - Non-Lepelletier (Rel to 4 sp AT) | NUATO-NL | 2.0 - 2.5 | 2.0 - 2.5 | 2.0 - 2.5 | IATC | ||||||||||||||
| 6-speed Dry DCT (Rel to 6 sp AT - Lepelletier) | 6DCT-D | 3.5 - 4.5 | 3.5 - 4.5 | N/A | 6 sp AT | ||||||||||||||
| 6-speed Wet DCT (Rel to 6 sp AT - Lepelletier) (0.5% less than Dry Clutch) | 6DCT-W | 3.0 - 4.0 | 3.0 - 4.0 | 3.0 - 4.0 | 6 sp AT | ||||||||||||||
| 8-speed AT (Rel to 6 sp AT - Lepelletier) | 8AT | 1.5 - 2.0 | 1.5 - 2.0 | 1.5 - 2.0 | Previous Tech | ||||||||||||||
| 8-speed DCT (Rel to 6 sp DCT) | 8DCT | 1.5 - 2.0 | 1.5 - 2.0 | 1.5 - 2.0 | Previous Tech | ||||||||||||||
| High Efficiency Gearbox Level 1 (Auto) (HETRANS) | HEG1 | 2.3 - 2.7 | 2.3 - 2.7 | 2.3 - 2.7 | Previous Tech | ||||||||||||||
| High Efficiency Gearbox Level 2 (Auto, 2017 and Beyond) | HEG2 | 2.6 - 2.7 | 2.6 - 2.7 | 2.6 - 2.7 | Previous Tech | ||||||||||||||
| Shift Optimizer (ASL-2) | SHFTOPT | 0.5 - 1.0 | 0.5 - 1.0 | 0.5 - 1.0 | Previous Tech | ||||||||||||||
| Secondary Axle Disconnect | SAX | 1.4 - 3.0 | 1.4 - 3.0 | 1.4 - 3.0 | Baseline | ||||||||||||||
| Other Technologies | |||||||||||||||||||
| Continuously Variable Transmission with Improved internals (Rel to 6 sp AT) | CVT | 3.5 - 4.5 | 3.5 - 4.5 | N/A | Previous Tech | ||||||||||||||
| High Efficiency Gearbox (CVT) | CVT-HEG | 3.0 | 3.0 | N/A | Previous Tech | ||||||||||||||
| High Efficiency Gearbox (DCT) | DCT-HEG | 2.0 | 2.0 | 2.0 | Previous Tech | ||||||||||||||
| High Efficiency Gearbox Level 3 (Auto, 2020 and beyond) | HEG3 | 1.6 | 1.6 | 1.6 | Previous Tech | ||||||||||||||
| 9-10 speed Transmission (Auto, Rel to 8 sp AT) | 10SPD | 0.3 | 0.3 | 0.3 | Previous Tech | ||||||||||||||
| Electrified Accessories Technologies | Abbreviation | Most Likely | Most Likely | Most Likely | Relative To | ||||||||||||||
| NHTSA Technologies | |||||||||||||||||||
| Electric Power Steering | EPS | 1.3 | 1.1 | 0.8 | Baseline | ||||||||||||||
| Improved Accessories - Level 1 (70% Eff Alt, Elec. Water Pump and Fan) | IACC1 | 1.2 | 1.0 | 1.6 | Baseline | ||||||||||||||
| Improved Accessories - Level 2 (Mild regen alt strategy, Intelligent cooling) | IACC2 | 2.4 | 2.6 | 2.2 | Previous Tech | ||||||||||||||
| Hybrid Technologies | Abbreviation | Most Likely | Most Likely | Most Likely | Relative To | ||||||||||||||
| NHTSA Technologies | |||||||||||||||||||
| Stop-Start (12V Micro-Hybrid) (Retain NHTSA Estimates) | SS | 2.1 | 2.2 | 2.1 | Baseline | ||||||||||||||
| Percent Incremental Fuel Consumption Reductions: NRC Estimates | |||||||||||||||||||
| Midsize Car I4 DOHC | Large Car V6 DOHC | Large Light Truck V8 OHV | |||||||||||||||||
| Integrated Starter Generator | MHEV | 6.5 | 6.4 | 3.0 | Previous Tech | ||||||||||||||
| Strong Hybrid - P2 - Level 2 (Parallel 2 Clutch System) | SHEV2-P2 | 28.9 - 33.6 | 29.4 - 34.5 | 26.9 - 30.1 | Baseline | ||||||||||||||
| Strong Hybrid - PS - Level 2 (Power Split System) | SHEV2-PS | 33.0 - 33.5 | 32.0 - 34.1 | N/A | Baseline | ||||||||||||||
| Plug-in Hybrid - 40 mile range | PHEV40 | N/A | N/A | N/A | Baseline | ||||||||||||||
| Electric Vehicle - 75 mile | EV75 | N/A | N/A | N/A | Baseline | ||||||||||||||
| Electric Vehicle - 100 mile | EV100 | N/A | N/A | N/a | Baseline | ||||||||||||||
| Electric Vehicle - 150 mile | EV150 | N/A | N/A | N/A | Baseline | ||||||||||||||
| Other Technologies | |||||||||||||||||||
| Fuel Cell Electric Vehicle | FCEV | N/A | N/A | N/A | Baseline | ||||||||||||||
| Vehicle Technologies | Abbreviation | Most Likely | Most Likely | Most Likely | Relative To | ||||||||||||||
| NHTSA Technologies | |||||||||||||||||||
| Without Engine Downsizingd | |||||||||||||||||||
| 0 - 2.5% Mass Reduction (Design Optimization) | MR2.5 | 0.80 | 0.80 | 0.85 | Baseline | ||||||||||||||
| 2.5 - 5% Mass Reduction | 0.81 | 0.81 | 0.85 | Previous MR | |||||||||||||||
| 0 - 5% Mass Reduction (Material Substitution) | MR5 | 1.60 | 1.60 | 1.69 | Baseline | ||||||||||||||
| With Engine Downsizing (Same Architecture)d | |||||||||||||||||||
| 5 - 10% Mass Reduction | 4.57 | 4.57 | 2.85 | Previous MR | |||||||||||||||
| 0 - 10% Mass Reduction (HSLA Steel and Aluminum Closures) | MR10 | 6.10 | 6.10 | 4.49 | Baseline | ||||||||||||||
| 10 - 15% Mass Reduction (Aluminum Body) | 3.25 | 3.25 | 2.35 | Previous MR | |||||||||||||||
| 0 - 15% Mass Reduction (Aluminum Body) | MR15 | 9.15 | 9.15 | 6.73 | Baseline | ||||||||||||||
| 15 - 20% Mass Reduction | 3.37 | 3.37 | 2.41 | Previous MR | |||||||||||||||
| 0 - 20% Mass Reduction (Aluminum Body, Magnesium, Composites) | MR20 | 12.21 | 12.21 | 8.98 | Baseline | ||||||||||||||
| 20 - 25% Mass Reduction | 3.47 | 3.47 | 2.46 | Previous MR | |||||||||||||||
| 0 - 25% Mass Reduction (Carbon Fiber Composite Body) | MR25 | 15.26 | 15.26 | 11.22 | Baseline | ||||||||||||||
| Summary - Mass Reduction Relative to Baseline | |||||||||||||||||||
| 0 - 2.5% Mass Reduction | MR2.5 | 0.80 | 0.80 | 0.85 | Baseline | ||||||||||||||
| 0 - 5% Mass Reduction | MR5 | 1.60 | 1.60 | 1.69 | Baseline | ||||||||||||||
| 0 - 10% Mass Reduction | MR10 | 6.10 | 6.10 | 4.49 | Baseline | ||||||||||||||
| 0 - 15% Mass Reduction | MR15 | 9.15 | 9.15 | 6.73 | Baseline | ||||||||||||||
| 0 - 20% Mass Reduction | MR20 | 12.21 | 12.21 | 8.98 | Baseline | ||||||||||||||
| 0 - 25% Mass Reduction | MR25 | 15.26 | 15.26 | 11.22 | Baseline | ||||||||||||||
| Low Rolling Resistance Tires - Level 1 (10% Reduction) | ROLL1 | 1.9 | 1.9 | 1.9 | Baseline | ||||||||||||||
| Low Rolling Resistance Tires - Level 2 (20% Reduction) | ROLL2 | 2.0 | 2.0 | 2.0 | Previous Tech | ||||||||||||||
| Low Drag Brakes | LDB | 0.8 | 0.8 | 0.8 | Baseline | ||||||||||||||
| Aerodynamic Drag Reduction - Level 1 (10% Reduction) | AERO1 | 2.3 | 2.3 | 2.3 | Baseline | ||||||||||||||
| Aerodynamic Drag Reduction - Level 2 (20% Reduction) | AERO2 | 2.5 | 2.5 | 2.5 | Previous Tech | ||||||||||||||
a Comparable to TRBDS1, TRBDS2, SS, MHEV, IACC1, IACC2
b With TWC aftertreatment. Costs will increase with lean NOx aftertreatment.
c Fuel consumption reduction in gge (gasoline gallons equivalent) [CAFE fuel consumption reduction]
d FC Reductions – Ricardo 2007. Car without engine downsizing: +3.3% mpg/10% MR = -3.2% FC/10% MR. Car with engine downsizing (for MR > 10%): +6.5% mpg/10%MR = -6.1% FC/10% MR. Truck without engine downsizing: +3.5% mpg/10% MR = -3.4% FC/10% MR. Truck with engine downsizing (for MR > 10%): +4.7% mpg/10%MR = 4.5% FC/10% MR.
NOTE: Midsize car: 3,500 lbs, large car: 4,500 lbs, large light truck: 5,500 lbs.
TABLE 8A.2a NRC Committee’s Estimated 2017 Direct Manufacturing Costs of Technologies
| 2017 MY Incremental Direct Manufacturing Costs (2010$): NRC Estimates | |||||||||||||||||||
| Midsize Car I4 DOHC | Large Car V6 DOHC | Large Light Truck V8 OHV | |||||||||||||||||
| Spark Ignition Engine Technologies | Abbreviation | Most Likely | Most Likely | Most Likely | Relative To | ||||||||||||||
| NHTSA Technologies | |||||||||||||||||||
| Low Friction Lubricants - Level 1 | LUB1 | 3 | 3 | 3 | Baseline | ||||||||||||||
| Engine Friction Reduction - Level 1 | EFR1 | 48 | 71 | 95 | Baseline | ||||||||||||||
| Low Friction Lubricants and Engine Friction Reduction - Level 2 | LUB2_EFR2 | 51 | 75 | 99 | Previous Tech | ||||||||||||||
| VVT- Intake Cam Phasing (CCP - Coupled Cam Phasing - OHV) | ICP | 37 - 43 | 74 - 86 | 37 | Baseline for DOHC | ||||||||||||||
| VVT- Dual Cam Phasing | DCP | 31 - 35 | 72 - 82 | 37 - 43 | Previous Tech | ||||||||||||||
| Discrete Variable Valve Lift | DVVL | 116 - 133 | 168 - 193 | 37 - 43 | Previous Tech | ||||||||||||||
| Continuously Variable Valve Lift | CVVL | 58 - 67 | 151 - 174 | N/A | Previous Tech | ||||||||||||||
| Cylinder Deactivation | DEACD | N/A | 139 | N/A | Previous Tech | ||||||||||||||
| Variable Valve Actuation (CCP + DVVL) | VVA | N/A | N/A | 157 | Baseline for OHV | ||||||||||||||
| Stoichiometric Gasoline Direct Injection | SGDI | 192 | 290 | 277 - 320 | Previous Tech | ||||||||||||||
| Turbocharging and Downsizing Level 1 - 18 bar BMEP 33%DS | TRBDS1 | 288 - 331 | -129 to -86 | 942 - 1,028 | Previous Tech | ||||||||||||||
| V6 to I4 and V8 to V6 | -455* to -369* | 841* to 962* | |||||||||||||||||
| Turbocharging and Downsizing Level 2 - 24 bar BMEP 50%DS | TRBDS2 | 182 | 182 | 308 | Previous Tech | ||||||||||||||
| I4 to I3 | -92* to -96* | ||||||||||||||||||
| Cooled EGR Level 1 - 24 bar BMEP, 50% DS | CEGR1 | 212 | 212 | 212 | Previous Tech | ||||||||||||||
| Cooled EGR Level 2 - 27 bar BMEP, 56% DS | CEGR2 | 364 | 364 | 614 | Previous Tech | ||||||||||||||
| V6 to I4 | -524* to -545* | ||||||||||||||||||
| Other Technologies | |||||||||||||||||||
| By 2025: | |||||||||||||||||||
| Compression Ratio Increase (with regular fuel) | CRI-REG | 50 | 75 | 100 | Baseline | ||||||||||||||
| Compression Ratio Increase (with higher octane regular fuel) | CRI-HO | 75 | 113 | 150 | Baseline | ||||||||||||||
| Compression Ratio Increase (CR~13:1, exh. scavenging, DI (aka Skyactiv, Atkinson Cycle)) | CRI-EXS | 250 | 375 | 500 | Baseline | ||||||||||||||
| Electrically Assisted Variable Speed Supercharger | EAVS-SC | 1,302 | 998 | N/A | Baseline | ||||||||||||||
| Lean Burn (with low sulfur fuel) | LBRN | 800 | 920 | 1,040 | Baseline | ||||||||||||||
| After 2025: | |||||||||||||||||||
| Variable Compression Ratio | VCR | Baseline | |||||||||||||||||
| D-EGR | DEGR | TRBDS1 | |||||||||||||||||
| Homogeneous Charge Compression Ignition (HCCI) + Spark Assisted CIa | SA-HCCI | TRBDS1 | |||||||||||||||||
| Gasoline Direct Injection Compression Ignition | GDCI | Baseline | |||||||||||||||||
| Waste Heat Recovery | WHR | Baseline | |||||||||||||||||
| Alternative Fuels: | |||||||||||||||||||
| CNG-Gasoline Bi-Fuel Vehicle | BCNG | 6,000 | 6,900 | 7,800 | Baseline | ||||||||||||||
| Flexible Fuel Vehicle | FFV | 75 | 100 | 125 | Baseline | ||||||||||||||
| Ethanol Boosted Direct Injection (incr CR to 14:1, 43% downsizing) | EBDI | 740 | 870 | 1,000 | Baseline | ||||||||||||||
| 2017 MY Incremental Direct Manufacturing Costs (2010$): NRC Estimates | |||||||||||||||||||
| Midsize Car I4 DOHC | Large Car V6 DOHC | Large Light Truck V8 OHV | |||||||||||||||||
| Diesel Engine Technologies | Abbreviation | Most Likely | Most Likely | Most Likely | Relative To | ||||||||||||||
| NHTSA Technologies | |||||||||||||||||||
| Advanced Diesel | ADSL | 3,023 | 3,565 | 3,795 | Baseline | ||||||||||||||
| Other Technologies | |||||||||||||||||||
| Low Pressure EGR | LPEGR | 133 | 166 | 166 | ADSL | ||||||||||||||
| Closed Loop Combustion Control | CLCC | 68 | 102 | 102 | ADSL | ||||||||||||||
| Injection Pressures Increased to 2,500 to 3,000 bar | INJ | 24 | 26 | 26 | ADSL | ||||||||||||||
| Downspeeding with Increased Boost Pressure | DS | 28 | 28 | 28 | ADSL | ||||||||||||||
| Friction Reduction | FR | 64 | 96 | 96 | ADSL | ||||||||||||||
| Waste Heat Recovery | WHR | N/A | N/A | N/A | |||||||||||||||
| Transmission Technologies | Abbreviation | Most Likely | Most Likely | Most Likely | Relative To | ||||||||||||||
| NHTSA Technologies | |||||||||||||||||||
| Improved Auto. Trans. Controls/Externals (ASL-1 & Early TC Lockup) | IATC | 50 | 50 | 50 | Baseline 4 sp AT | ||||||||||||||
| 6-speed AT with Improved Internals - Lepelletier (Rel to 4 sp AT) | NUATO-L | -13 | -13 | -13 | IATC | ||||||||||||||
| 6-speed AT with Improved Internals - Non-Lepelletier (Rel to 4 sp AT) | NUATO-NL | 195 | 195 | 195 | IATC | ||||||||||||||
| 6-speed Dry DCT (Rel to 6 sp AT - Lepelletier) | 6DCT-D | -149 to 31 | -149 to 31 | N/A | 6 sp AT | ||||||||||||||
| 6-speed Wet DCT (Rel to 6 sp AT - Lepelletier) | 6DCT-W | -88 to 88 | -88 to 88 | -88 to 88 | 6 sp AT | ||||||||||||||
| 8-speed AT (Rel to 6 sp AT - Lepelletier) | 8AT | 56 - 151 | 56 - 151 | 56 - 151 | Previous Tech | ||||||||||||||
| 8-speed DCT (Rel to 6 sp DCT) | 8DCT | 179 | 179 | 179 | Previous Tech | ||||||||||||||
| High Efficiency Gearbox Level 1 (Auto) (HETRANS) | HEG1 | 120 | 120 | 120 | Previous Tech | ||||||||||||||
| High Efficiency Gearbox Level 2 (Auto, 2017 and Beyond) | HEG2 | 194 | 194 | 194 | Previous Tech | ||||||||||||||
| Shift Optimizer (ASL-2) | SHFTOPT | 26 | 26 | 26 | Previous Tech | ||||||||||||||
| Secondary Axle Disconnect | SAX | 100 | 100 | 100 | Baseline | ||||||||||||||
| Other Technologies | |||||||||||||||||||
| Continuously Variable Transmission with Improved internals (Rel to 6 sp AT) | CVT | 179 | 179 | N/A | Baseline | ||||||||||||||
| High Efficiency Gearbox (CVT) | CVT-HEG | 125 | 125 | N/A | Baseline | ||||||||||||||
| High Efficiency Gearbox (DCT) | DCT-HEG | 150 | 150 | 150 | Baseline | ||||||||||||||
| High Efficiency Gearbox Level 3 (Auto, 2020 and Beyond) | HEG3 | 150 | 150 | 150 | Baseline | ||||||||||||||
| 9-10 speed Transmission (Auto, Rel to 8 sp AT) | 10SPD | 75 | 75 | 75 | Baseline | ||||||||||||||
| Electrified Accessories Technologies | Abbreviation | Most Likely | Most Likely | Most Likely | Relative To | ||||||||||||||
| NHTSA Technologies | |||||||||||||||||||
| Electric Power Steering | EPS | 87 | 87 | 87 | Baseline | ||||||||||||||
| Improved Accessories - Level 1 (70% Eff Alt, Elec. Water | IACC1 | 71 | 71 | 71 | Baseline | ||||||||||||||
| Pump and Fan) | |||||||||||||||||||
| Improved Accessories - Level 2 (Mild regen alt strategy, | IACC2 | 43 | 43 | 43 | Previous Tech | ||||||||||||||
| Intelligent cooling) | |||||||||||||||||||
| Hybrid Technologies | Abbreviation | Most Likely | Most Likely | Most Likely | Relative To | ||||||||||||||
| NHTSA Technologies | |||||||||||||||||||
| Stop-Start (12V Micro-Hybrid) | SS | 287 - 387 | 325 - 425 | 356 - 456 | Baseline | ||||||||||||||
| 2017 MY Incremental Direct Manufacturing Costs (2010$): NRC Estimates | |||||||||||||||||||
| Midsize Car I4 DOHC | Large Car V6 DOHC | Large Light Truck V8 OHV | |||||||||||||||||
| Integrated Starter Generator MHEV | 1,087 - 1,253 | 1,087 - 1,377 | 1,087 - 1,438 | Previous Tech | |||||||||||||||
| Strong Hybrid - P2 - Level 2 (Parallel 2 Clutch System) SHEV2-P2 | 2,463 - 3,126 | 2,908 - 3,726 | 2,947 - 3,762 | Baseline | |||||||||||||||
| Strong Hybrid - PS - Level 2 (Power Split System) SHEV2-PS | 3,139 | 3,396 | N/A | Baseline | |||||||||||||||
| Plug-in Hybrid - 40 mile range PHEV40 | 13,193 - 14,776 | 17,854 - 20,141 | N/A | Baseline | |||||||||||||||
| Electric Vehicle - 75 mile EV75 | 14,812 - 15,446 | 19,275 - 20,393 | N/A | Baseline | |||||||||||||||
| Electric Vehicle - 100 mile EV100 | 16,831 | 21,123 | N/A | Baseline | |||||||||||||||
| Electric Vehicle - 150 mile EV150 | 22,257 | 26,193 | N/A | Baseline | |||||||||||||||
| Other Technologies | |||||||||||||||||||
| Fuel Cell Electric Vehicle FCEV | N/A | N/A | N/A | Baseline | |||||||||||||||
| Vehicle Technologies Abbreviation | Most Likely | Most Likely | Most Likely | Relative To | |||||||||||||||
| NHTSA Technologies | |||||||||||||||||||
| Without Engine Downsizing | |||||||||||||||||||
| 0 - 2.5% Mass Reduction (Design Optimization) MR2.5 | 0 - 22 | 0 - 28 | 0 - 39 | Baseline | |||||||||||||||
| 2.5 - 5% Mass Reduction | 0 - 66 | 0 - 84 | 0 - 116 | Previous MR | |||||||||||||||
| 0 - 5% Mass Reduction (Material Substitution) MR5 | 0 - 88 | 0 - 113 | 0 - 154 | Baseline | |||||||||||||||
| With Engine Downsizing (Same Architecture)b | |||||||||||||||||||
| 5 - 10% Mass Reduction | 154 - 325 | 198 - 419 | 270 - 572 | Previous MR | |||||||||||||||
| 0 - 10% Mass Reduction (HSLA Steel and Aluminum Closures) MR10 | 154 - 413 | 198 - 531 | 270 - 726 | Baseline | |||||||||||||||
| 10 - 15% Mass Reduction (Aluminum Body) | 452 - 767 | 581 - 986 | 792 - 1,353 | Baseline | |||||||||||||||
| 0 - 15% Mass Reduction (Aluminum Body) MR15 | 452 - 767 | 581 - 986 | 792 - 1,353 | Baseline | |||||||||||||||
| 15 - 20% Mass Reduction | 528 - 654 | 679 - 841 | 924 - 1,144 | Previous MR | |||||||||||||||
| 0 - 20% Mass Reduction (Aluminum Body, Magnesium, MR20 | 980 - 1,421 | 1,260 - 1,827 | 1,716 - 2,497 | Baseline | |||||||||||||||
| Composites) | |||||||||||||||||||
| 20 - 25% Mass Reduction | 1,173 - 1,449 | 1,508 - 1,863 | 2,079 - 2,549 | Previous MR | |||||||||||||||
| 0 - 25% Mass Reduction (Carbon Fiber Composite Body) MR25 | 2,153 - 2,870 | 2,768 - 3,690 | 3,795 - 5,046 | Baseline | |||||||||||||||
| Mass Reduction Cost ($ per lb.) | |||||||||||||||||||
| 0 - 2.5% Mass Reduction MR2.5 | 0.00 to 0.25 | 0.00 to 0.25 | 0.00 - 0.28 | Baseline | |||||||||||||||
| 0 - 5% Mass Reduction MR5 | 0.00 to 0.50 | 0.00 to 0.50 | 0.00 - 0.56 | Baseline | |||||||||||||||
| 0 - 10% Mass Reduction MR10 | 0.44 to 1.18 | 0.44 to 1.18 | 0.49 - 1.32 | Baseline | |||||||||||||||
| 0 - 15% Mass Reduction MR15 | 0.86 - 1.46 | 0.86 - 1.46 | 0.96 - 1.64 | Baseline | |||||||||||||||
| 0 - 20% Mass Reduction MR20 | 1.40 - 2.03 | 1.40 - 2.03 | 1.56 - 2.27 | Baseline | |||||||||||||||
| 0 - 25% Mass Reduction MR25 | 2.46 - 3.28 | 2.46 - 3.28 | 2.76 - 3.67 | Baseline | |||||||||||||||
| Low Rolling Resistance Tires - Level 1 (10% Reduction) ROLL1 | 5 | 5 | 5 | Baseline | |||||||||||||||
| Low Rolling Resistance Tires - Level 2 (20% Reduction) ROLL2 | 58 | 58 | 58 | Previous Tech | |||||||||||||||
| Low Drag Brakes LDB | 59 | 59 | 59 | Baseline | |||||||||||||||
| Aerodynamic Drag Reduction - Level 1 (10% Reduction) AERO1 | 39 | 39 | 39 | Baseline | |||||||||||||||
| Aerodynamic Drag Reduction - Level 2 (20% Reduction) AERO2 | 117 | 117 | 117 | Previous Tech | |||||||||||||||
*Costs with reduced number of cylinders, adjusted for previously added technologies – see Appendix T for the derivation of the turbocharged, downsized engine costs.
a With TWC aftertreatment. Costs will increase with lean NOx aftertreatment.
b Includes mass decompounding: 40% for cars, 25% for trucks.
NOTE: Midsize car: 3,500 lbs, large car: 4,500 lbs, large light truck: 5,500 lbs.
TABLE 8A.2b NRC Committee’s Estimated 2020 MY Direct Manufacturing Costs of Technologies
| 2020 MY Incremental Direct Manufacturing Costs (2010$): NRC Estimates | |||||||||||||||||||
| Midsize Car I4 DOHC | Large Car V6 DOHC | Large Light Truck V8 OHV | |||||||||||||||||
| Spark Ignition Engine Technologies | Abbreviation | Most Likely | Most Likely | Most Likely | Relative To | ||||||||||||||
| NHTSA Technologies | |||||||||||||||||||
| Low Friction Lubricants - Level 1 | LUB1 | 3 | 3 | 3 | Baseline | ||||||||||||||
| Engine Friction Reduction - Level 1 | EFR1 | 48 | 71 | 95 | Baseline | ||||||||||||||
| Low Friction Lubricants and Engine Friction Reduction - Level 2 | LUB2_EFR2 | 51 | 75 | 99 | Previous Tech | ||||||||||||||
| VVT- Intake Cam Phasing (CCP - Coupled Cam Phasing - OHV) | ICP | 35 - 41 | 70 - 81 | 35- 41 | Baseline for DOHC | ||||||||||||||
| VVT- Dual Cam Phasing | DCP | 29 - 33 | 67 - 76 | 35 - 41 | Previous Tech | ||||||||||||||
| Discrete Variable Valve Lift | DVVL | 109 - 125 | 158 - 182 | N/A | Previous Tech | ||||||||||||||
| Continuously Variable Valve Lift | CVVL | 55 - 63 | 142 - 163 | N/A | Previous Tech | ||||||||||||||
| Cylinder Deactivation | DEACD | N/A | 131 | 147 | Previous Tech | ||||||||||||||
| Variable Valve Actuation (CCP + DVVL) | VVA | N/A | N/A | 261 - 301 | Baseline for OHV | ||||||||||||||
| Stoichiometric Gasoline Direct Injection | SGDI | 181 | 273 | 328 | Previous Tech | ||||||||||||||
| Turbocharging and Downsizing Level 1 - 18 bar BMEP 33%DS | TRBDS1 | 271 - 312 | -122 to -81 | 877 - 958 | Previous Tech | ||||||||||||||
| V6 to I4 and V8 to V6 | -432* to -349* | 779* - 891* | |||||||||||||||||
| Turbocharging and Downsizing Level 2 - 24 bar BMEP 50%DS | TRBDS2 | 172 | 172 | 289 | Previous Tech | ||||||||||||||
| I4 to I3 | -89* to -92* | ||||||||||||||||||
| Cooled EGR Level 1 - 24 bar BMEP, 50% DS | CEGR1 | 199 | 199 | 199 | Previous Tech | ||||||||||||||
| Cooled EGR Level 2 - 27 bar BMEP, 56% DS | CEGR2 | 343 | 343 | 579 | Previous Tech | ||||||||||||||
| V6 to I4 | -522* to -514* | ||||||||||||||||||
| Other Technologies | |||||||||||||||||||
| By 2025: | |||||||||||||||||||
| Compression Ratio Increase (with regular fuel) | CRI-REG | 50 | 75 | 100 | Baseline | ||||||||||||||
| Compression Ratio Increase (with higher octane regular fuel) | CRI-HO | 75 | 113 | 150 | Baseline | ||||||||||||||
| Compression Ratio Increase (CR~13:1, exh. scavenging, DI (aka Skyactiv, Atkinson Cycle)) | CRI-EXS | 250 | 375 | 500 | Baseline | ||||||||||||||
| Electrically Assisted Variable Speed Supercharger | EAVS-SC | 1,302 | 998 | N/A | Baseline | ||||||||||||||
| Lean Burn (with low sulfur fuel) | LBRN | 800 | 920 | 1,040 | Baseline | ||||||||||||||
| After 2025: | |||||||||||||||||||
| Variable Compression Ratio | VCR | Baseline | |||||||||||||||||
| D-EGR | DEGR | TRBDS1 | |||||||||||||||||
| Homogeneous Charge Compression Ignition (HCCI) + Spark Assisted CIa | SA-HCCI | TRBDS1 | |||||||||||||||||
| Gasoline Direct Injection Compression Ignition | GDCI | Baseline | |||||||||||||||||
| Waste Heat Recovery | WHR | Baseline | |||||||||||||||||
| Alternative Fuels: | |||||||||||||||||||
| CNG-Gasoline Bi-Fuel Vehicle | BCNG | 6,000 | 6,900 | 7,800 | Baseline | ||||||||||||||
| Flexible Fuel Vehicle | FFV | 75 | 100 | 125 | Baseline | ||||||||||||||
| Ethanol Boosted Direct Injection (incr CR to 14:1, 43% downsizing) | EBDI | 740 | 870 | 1,000 | Baseline | ||||||||||||||
| 2020 MY Incremental Direct Manufacturing Costs (2010$): NRC Estimates | |||||||||||||||||||
| Midsize Car I4 DOHC | Large Car V6 DOHC | Large Light Truck V8 OHV | |||||||||||||||||
| Diesel Engine Technologies | Abbreviation | Most Likely | Most Likely | Most Likely | Relative To | ||||||||||||||
| NHTSA Technologies | |||||||||||||||||||
| Advanced Diesel | ADSL | 2,845 | 3,356 | 3,571 | Baseline | ||||||||||||||
| Other Technologies | |||||||||||||||||||
| Low Pressure EGR | LPEGR | 125 | 157 | 157 | ADSL | ||||||||||||||
| Closed Loop Combustion Control | CLCC | 64 | 96 | 96 | ADSL | ||||||||||||||
| Injection Pressures Increased to 2,500 to 3,000 bar | INJ | 23 | 25 | 25 | ADSL | ||||||||||||||
| Downspeeding with Increased Boost Pressure | DS | 26 | 26 | 26 | ADSL | ||||||||||||||
| Friction Reduction | FR | 60 | 91 | 91 | ADSL | ||||||||||||||
| Waste Heat Recovery | WHR | N/A | N/A | N/A | |||||||||||||||
| Transmission Technologies | Abbreviation | Most Likely | Most Likely | Most Likely | Relative To | ||||||||||||||
| NHTSA Technologies | |||||||||||||||||||
| Improved Auto. Trans. Controls/Externals (ASL-1 & Early TC Lockup) | IATC | 46 | 46 | 46 | Baseline 4 sp AT | ||||||||||||||
| 6-speed AT with Improved Internals - Lepelletier (Rel to 4 sp AT) | NUATO-L | -12 | -12 | -12 | IATC | ||||||||||||||
| 6-speed AT with Improved Internals - Non-Lepelletier (Rel to 4 sp AT) | NUATO-NL | 181 | 181 | 181 | IATC | ||||||||||||||
| 6-speed Dry DCT (Rel to 6 sp AT - Lepelletier) | 6DCT-D | -138 to 28 | -138 to 28 | N/A | 6 sp AT | ||||||||||||||
| 6-speed Wet DCT (Rel to 6 sp AT - Lepelletier) | 6DCT-W | -82 to 82 | -82 to 82 | -82 to 82 | 6 sp AT | ||||||||||||||
| 8-speed AT (Rel to 6 sp AT - Lepelletier) | 8AT | 52 - 126 | 52 - 126 | 52 - 126 | Previous Tech | ||||||||||||||
| 8-speed DCT (Rel to 6 sp DCT) | 8DCT | 167 | 167 | 167 | Previous Tech | ||||||||||||||
| High Efficiency Gearbox Level 1 (Auto) (HETRANS) | HEG1 | 113 | 113 | 113 | Previous Tech | ||||||||||||||
| High Efficiency Gearbox Level 2 (Auto, 2017 and Beyond) | HEG2 | 183 | 183 | 183 | Previous Tech | ||||||||||||||
| Shift Optimizer (ASL-2) | SHFTOPT | 24 | 24 | 24 | Previous Tech | ||||||||||||||
| Secondary Axle Disconnect | SAX | 94 | 94 | 94 | Baseline | ||||||||||||||
| Other Technologies | |||||||||||||||||||
| Continuously Variable Transmission with Improved internals (Rel to 6 sp AT) | CVT | 168 | 168 | NA | Baseline | ||||||||||||||
| High Efficiency Gearbox (CVT) | CVT-HEG | 117 | 117 | NA | Baseline | ||||||||||||||
| High Efficiency Gearbox (DCT) | DCT-HEG | 141 | 141 | 141 | Baseline | ||||||||||||||
| High Efficiency Gearbox Level 3 (Auto, 2020 and beyond) | HEG3 | 141 | 141 | 141 | Baseline | ||||||||||||||
| 9-10 speed Transmission (Auto, Rel to 8 sp AT) | 10SPD | 71 | 71 | 71 | Baseline | ||||||||||||||
| Electrified Accessories Technologies | Abbreviation | Most Likely | Most Likely | Most Likely | Relative To | ||||||||||||||
| NHTSA Technologies | |||||||||||||||||||
| Electric Power Steering | EPS | 82 | 82 | 82 | Baseline | ||||||||||||||
| Improved Accessories - Level 1 (70% Eff Alt, Elec. Water Pump and Fan) | IACC1 | 67 | 67 | 67 | Baseline | ||||||||||||||
| Improved Accessories - Level 2 (Mild regen alt strategy, Intelligent cooling) | IACC2 | 40 | 40 | 40 | Previous Tech | ||||||||||||||
| Hybrid Technologies | Abbreviation | Most Likely | Most Likely | Most Likely | Relative To | ||||||||||||||
| NHTSA Technologies | |||||||||||||||||||
| Stop-Start (12V Micro-Hybrid) | SS | 261 - 336 | 296 - 371 | 325 - 400 | Baseline | ||||||||||||||
| 2020 MY Incremental Direct Manufacturing Costs (2010$): NRC Estimates | |||||||||||||||||||
| Midsize Car I4 DOHC | Large Car V6 DOHC | Large Light Truck V8 OHV | |||||||||||||||||
| Integrated Starter Generator | MHEV | 1,008 - 1,160 | 1,008 - 1,274 | 1,008 - 1,329 | Previous Tech | ||||||||||||||
| Strong Hybrid - P2 - Level 2 (Parallel 2 Clutch System) | SHEV2-P2 | 2,295 - 2,912 | 2,410 - 3,472 | 2,744 - 3,503 | Baseline | ||||||||||||||
| Strong Hybrid - PS - Level 2 (Power Split System) | SHEV2-PS | 2,954 | 3,196 | N/A | Baseline | ||||||||||||||
| Plug-in Hybrid - 40 mile range | PHEV40 | 9,763 - 11,253 | 13,172 - 15,325 | N/A | Baseline | ||||||||||||||
| Electric Vehicle - 75 mile | EV75 | 10,189 - 10,768 | 13,310 - 14,331 | N/A | Baseline | ||||||||||||||
| Electric Vehicle - 100 mile | EV100 | 11,482 | 14,492 | N/A | Baseline | ||||||||||||||
| Electric Vehicle - 150 mile | EV150 | 14,954 | 17,737 | N/A | Baseline | ||||||||||||||
| Other Technologies | |||||||||||||||||||
| Fuel Cell Electric Vehicle | FCEV | N/A | N/A | N/A | |||||||||||||||
| Vehicle Technologies | Abbreviation | Most Likely | Most Likely | Most Likely | Relative To | ||||||||||||||
| NHTSA Technologies | |||||||||||||||||||
| Without Engine Downsizing | |||||||||||||||||||
| 0 - 2.5% Mass Reduction (Design Optimization) | MR2.5 | 0 - 22 | 0 - 28 | 0 - 39 | |||||||||||||||
| 2.5 - 5% Mass Reduction | 0 - 66 | 0 - 84 | 0 - 116 | ||||||||||||||||
| 0 - 5% Mass Reduction (Material Substitution) | MR5 | 0 - 88 | 0 - 113 | 0 - 154 | |||||||||||||||
| With Engine Downsizing (Same Architecture)b | |||||||||||||||||||
| 5 - 10% Mass Reduction | 151 - 322 | 194 - 414 | 270 - 567 | Previous MR | |||||||||||||||
| 0 - 10% Mass Reduction (HSLA Steel and Aluminum Closures) | MR10 | 151 - 410 | 194 - 527 | 270 - 721 | Baseline | ||||||||||||||
| 10 - 15% Mass Reduction (Aluminum Body) | 441 - 751 | 567 - 965 | 776 - 1,320 | Baseline | |||||||||||||||
| 0 - 15% Mass Reduction (Aluminum Body) | MR15 | 441 - 751 | 567 - 965 | 776 - 1,320 | Baseline | ||||||||||||||
| 15 - 20% Mass Reduction | 518 - 635 | 666 - 817 | 907 - 1,122 | Previous MR | |||||||||||||||
| 0 - 20% Mass Reduction (Aluminum Body, Magnesium, Composites) | MR20 | 959 - 1,386 | 1,233 - 1,782 | 1,683 - 2,442 | Baseline | ||||||||||||||
| 20 - 25% Mass Reduction | 1,115 - 1,379 | 1,433 - 1,773 | 1,961 - 2,426 | Previous MR | |||||||||||||||
| 0 - 25% Mass Reduction (Carbon Fiber Composite Body) | MR25 | 2,074 - 2,765 | 2,666 - 3,555 | 3,644 - 4,868 | Baseline | ||||||||||||||
| Mass Reduction Cost ($ per lb.) | |||||||||||||||||||
| 0 - 2.5% Mass Reduction | MR2.5 | 0.00 - 0.25 | 0.00 - 0.25 | 0.00 - 0.28 | |||||||||||||||
| 0 - 5% Mass Reduction | MR5 | 0.00 - 0.50 | 0.00 - 0.50 | 0.00 - 0.56 | Baseline | ||||||||||||||
| 0 - 10% Mass Reduction | MR10 | 0.43 - 1.17 | 0.43 - 1.17 | 0.49 - 1.31 | Baseline | ||||||||||||||
| 0 - 15% Mass Reduction | MR15 | 0.84 - 1.43 | 0.84 - 1.43 | 0.94 - 1.60 | Baseline | ||||||||||||||
| 0 - 20% Mass Reduction | MR20 | 1.37 - 1.98 | 1.37 - 1.98 | 1.53 - 2.22 | Baseline | ||||||||||||||
| 0 - 25% Mass Reduction | MR25 | 2.37 - 3.16 | 2.37 - 3.16 | 2.65 - 3.54 | Baseline | ||||||||||||||
| Low Rolling Resistance Tires - Level 1 (10% Reduction) | ROLL1 | 5 | 5 | 5 | Baseline | ||||||||||||||
| Low Rolling Resistance Tires - Level 2 (20% Reduction) | ROLL2 | 46 | 46 | 46 | Previous Tech | ||||||||||||||
| Low Drag Brakes | LDB | 59 | 59 | 59 | Baseline | ||||||||||||||
| Aerodynamic Drag Reduction - Level 1 (10% Reduction) | AERO1 | 37 | 37 | 37 | Baseline | ||||||||||||||
| Aerodynamic Drag Reduction - Level 2 (20% Reduction) | AERO2 | 110 | 110 | 110 | Previous Tech | ||||||||||||||
*Costs with reduced number of cylinders, adjusted for previously added technologies – see Appendix T for the derivation of the turbocharged, downsized engine costs.
a With TWC aftertreatment. Costs will increase with lean NOx aftertreatment.
b Includes mass decompounding: 40% for cars, 25% for trucks.
NOTE: Midsize car: 3,500 lbs, large car: 4,500 lbs, large light truck: 5,500 lbs.
TABLE 8A.2c NRC Committee’s Estimated 2025 MY Direct Manufacturing Costs of Technologies
| 2025 MY Incremental Direct Manufacturing Costs (2010$): NRC Estimates | |||||||||||||||||||
| Midsize Car I4 DOHC | Large Car V6 DOHC | Large Light Truck V8 OHV | |||||||||||||||||
| Spark Ignition Engine Technologies Abbreviation | Most Likely | Most Likely | Most Likely | Relative To | |||||||||||||||
| NHTSA Technologies | |||||||||||||||||||
| Low Friction Lubricants - Level 1 LUB1 | 3 | 3 | 3 | Baseline | |||||||||||||||
| Engine Friction Reduction - Level 1 EFR1 | 48 | 71 | 95 | Baseline | |||||||||||||||
| Low Friction Lubricants and Engine Friction Reduction - LUB2_EFR2 Level 2 | 51 | 75 | 99 | Previous Tech | |||||||||||||||
| VVT- Intake Cam Phasing (CCP - Coupled Cam Phasing - ICP OHV) | 31 - 36 | 63 - 73 | 31 - 36 | Baseline for DOHC | |||||||||||||||
| VVT- Dual Cam Phasing DCP | 27 - 31 | 61 - 69 | 31 - 36 | Previous Tech | |||||||||||||||
| Discrete Variable Valve Lift DVVL | 99 - 114 | 143 - 164 | N/A | Previous Tech | |||||||||||||||
| Continuously Variable Valve Lift CVVL | 49 - 56 | 128 - 147 | N/A | Previous Tech | |||||||||||||||
| Cylinder Deactivation DEACD | N/A | 118 | 133 | Previous Tech | |||||||||||||||
| Variable Valve Actuation (CCP + DVVL) VVA | N/A | N/A | 235 - 271 | Baseline for OHV | |||||||||||||||
| Stoichiometric Gasoline Direct Injection SGDI | 164 | 246 | 296 | Previous Tech | |||||||||||||||
| Turbocharging and Downsizing Level 1 - 18 bar BMEP 33%DS TRBDS1 | 245 - 282 | -110 to -73 | 788 - 862 | Previous Tech | |||||||||||||||
| V6 to I4 and V8 to V6 | -396* to -316* | 700* - 800* | |||||||||||||||||
| Turbocharging and Downsizing Level 2 - 24 bar BMEP 50%DS TRBDS2 | 155 | 155 | 261 | Previous Tech | |||||||||||||||
| I4 to I3 | -82* to -86* | ||||||||||||||||||
| Cooled EGR Level 1 - 24 bar BMEP, 50% DS CEGR1 | 180 | 180 | 180 | Previous Tech | |||||||||||||||
| Cooled EGR Level 2 - 27 bar BMEP, 56% DS CEGR2 | 310 | 310 | 523 | Previous Tech | |||||||||||||||
| V6 to I4 | -453* to -469* | ||||||||||||||||||
| Other Technologies | |||||||||||||||||||
| By 2025: | |||||||||||||||||||
| Compression Ratio Increase (with regular fuel) CRI-REG | 50 | 75 | 100 | Baseline | |||||||||||||||
| Compression Ratio Increase (with higher octane regular fuel) CRI-HO | 75 | 113 | 150 | Baseline | |||||||||||||||
| Compression Ratio Increase (CR~13:1, exh. scavenging, DI CRI-EXS (aka Skyactiv, Atkinson Cycle)) | 250 | 375 | 500 | Baseline | |||||||||||||||
| Electrically Assisted Variable Speed Supercharger EAVS-SC | 1,302 | 998 | N/A | Baseline | |||||||||||||||
| Lean Burn (with low sulfur fuel) LBRN | 800 | 920 | 1,040 | Baseline | |||||||||||||||
| After 2025: | |||||||||||||||||||
| Variable Compression Ratio VCR | 597 | 687 | 896 | Baseline | |||||||||||||||
| D-EGR DEGR | 667 | 667 | 667 | TRBDS1 | |||||||||||||||
| Homogeneous Charge Compression Ignition (HCCI) + Spark SA-HCCI | 450 | 500 | 550 | TRBDS1 | |||||||||||||||
| Assisted CIa | |||||||||||||||||||
| Gasoline Direct Injection Compression Ignition GDCI | 2,500 | 2,875 | 3,750 | Baseline | |||||||||||||||
| Waste Heat Recovery WHR | 700 | 805 | 1,050 | Baseline | |||||||||||||||
| Alternative Fuels: | |||||||||||||||||||
| CNG-Gasoline Bi-Fuel Vehicle BCNG | 6,000 | 6,900 | 7,800 | Baseline | |||||||||||||||
| Flexible Fuel Vehicle FFV | 75 | 100 | 125 | Baseline | |||||||||||||||
| Ethanol Boosted Direct Injection (incr CR to 14:1, 43% EBDI downsizing) | 740 | 870 | 1,000 | Baseline | |||||||||||||||
| 2025 MY Incremental Direct Manufacturing Costs (2010$): NRC Estimates | |||||||||||||||||||
| Midsize Car I4 DOHC | Large Car V6 DOHC | Large Light Truck V8 OHV | |||||||||||||||||
| Diesel Engine Technologies | Abbreviation | Most Likely | Most Likely | Most Likely | Relative To | ||||||||||||||
| NHTSA Technologies | |||||||||||||||||||
| Advanced Diesel | ADSL | 2,572 | 3,034 | 3,228 | Baseline | ||||||||||||||
| Other Technologies | |||||||||||||||||||
| Low Pressure EGR | LPEGR | 113 | 141 | 141 | ADSL | ||||||||||||||
| Closed Loop Combustion Control | CLCC | 58 | 87 | 87 | ADSL | ||||||||||||||
| Injection Pressures Increased to 2,500 to 3,000 bar | INJ | 20 | 22 | 22 | ADSL | ||||||||||||||
| Downspeeding with Increased Boost Pressure | DS | 24 | 24 | 24 | ADSL | ||||||||||||||
| Friction Reduction | FR | 54 | 82 | 82 | ADSL | ||||||||||||||
| Waste Heat Recovery | WHR | 700 | 805 | 1,050 | ADSL | ||||||||||||||
| Transmission Technologies | Abbreviation | Most Likely | Most Likely | Most Likely | Relative To | ||||||||||||||
| NHTSA Technologies | |||||||||||||||||||
| Improved Auto. Trans. Controls/Externals (ASL-1 & Early TC Lockup) | IATC | 42 | 42 | 42 | Baseline 4 sp AT | ||||||||||||||
| 6-speed AT with Improved Internals - Lepelletier (Rel to 4 sp AT) | NUATO-L | -11 | -11 | -11 | IATC | ||||||||||||||
| 6-speed AT with Improved Internals - Non-Lepelletier (Rel to 4 sp AT) | NUATO-NL | 165 | 165 | 165 | IATC | ||||||||||||||
| 6-speed Dry DCT (Rel to 6 sp AT - Lepelletier) | 6DCT-D | -127 to 26 | -127 to 26 | N/A | 6 sp AT | ||||||||||||||
| 6-speed Wet DCT (Rel to 6 sp AT - Lepelletier) | 6DCT-W | -75 to 75 | -75 to 75 | -75 to 75 | 6 sp AT | ||||||||||||||
| 8-speed AT (Rel to 6 sp AT - Lepelletier) | 8AT | 47 - 115 | 47 - 115 | 47 - 115 | Previous Tech | ||||||||||||||
| 8-speed DCT (Rel to 6 sp DCT) | 8DCT | 152 | 152 | 152 | Previous Tech | ||||||||||||||
| High Efficiency Gearbox Level 1 (Auto) (HETRANS) | HEG1 | 102 | 102 | 102 | Previous Tech | ||||||||||||||
| High Efficiency Gearbox Level 2 (Auto, 2017 and Beyond) | HEG2 | 165 | 165 | 165 | Previous Tech | ||||||||||||||
| Shift Optimizer (ASL-2) | SHFTOPT | 22 | 22 | 22 | Previous Tech | ||||||||||||||
| Secondary Axle Disconnect | SAX | 86 | 86 | 86 | Baseline | ||||||||||||||
| Other Technologies | |||||||||||||||||||
| Continuously Variable Transmission with Improved internals (Rel to 6 sp AT) | CVT | 154 | 154 | NA | Baseline | ||||||||||||||
| High Efficiency Gearbox (CVT) | CVT-HEG | 107 | 107 | NA | Baseline | ||||||||||||||
| High Efficiency Gearbox (DCT) | DCT-HEG | 127 | 127 | 127 | Baseline | ||||||||||||||
| High Efficiency Gearbox Level 3 (Auto, 2020 and beyond) | HEG3 | 128 | 128 | 128 | Baseline | ||||||||||||||
| 9-10 speed Transmission (Auto, Rel to 8 sp AT) | 10SPD | 65 | 65 | 65 | Baseline | ||||||||||||||
| Electrified Accessories Technologies | Abbreviation | Most Likely | Most Likely | Most Likely | Relative To | ||||||||||||||
| NHTSA Technologies | |||||||||||||||||||
| Electric Power Steering | EPS | 74 | 74 | 74 | Baseline | ||||||||||||||
| Improved Accessories - Level 1 (70% Eff Alt, Elec. Water Pump and Fan) | IACC1 | 60 | 60 | 60 | Baseline | ||||||||||||||
| Improved Accessories - Level 2 (Mild regen alt strategy, Intelligent cooling) | IACC2 | 37 | 37 | 37 | Previous Tech | ||||||||||||||
| Hybrid Technologies | Abbreviation | Most Likely | Most Likely | Most Likely | Relative To | ||||||||||||||
| NHTSA Technologies | |||||||||||||||||||
| Stop-Start (12V Micro-Hybrid) | SS | 225 - 275 | 255 - 305 | 279 - 329 | Baseline | ||||||||||||||
| 2025 MY Incremental Direct Manufacturing Costs (2010$): NRC Estimates | |||||||||||||||||||
| Midsize Car I4 DOHC | Large Car V6 DOHC | Large Light Truck V8 OHV | |||||||||||||||||
| Integrated Starter Generator | MHEV | 888 - 1,018 | 888 - 1,115 | 888 - 1,164 | Previous Tech | ||||||||||||||
| Strong Hybrid - P2 - Level 2 (Parallel 2 Clutch System) | SHEV2-P2 | 2,041 - 2,588 | 2,410 - 3,086 | 2,438 - 3,111 | Baseline | ||||||||||||||
| Strong Hybrid - PS - Level 2 (Power Split System) | SHEV2-PS | 2,671 | 2,889 | N/A | Baseline | ||||||||||||||
| Plug-in Hybrid - 40 mile range | PHEV40 | 8,325 - 9,672 | 11,189 - 13,135 | N/A | Baseline | ||||||||||||||
| Electric Vehicle - 75 mile | EV75 | 8,451 - 8,963 | 11,025 - 11,929 | N/A | Baseline | ||||||||||||||
| Electric Vehicle - 100 mile | EV100 | 9,486 | 11,971 | N/A | Baseline | ||||||||||||||
| Electric Vehicle - 150 mile | EV150 | 12,264 | 14,567 | N/A | Baseline | ||||||||||||||
| Other Technologies | |||||||||||||||||||
| Fuel Cell Electric Vehicle | FCEV | N/A | N/A | N/A | |||||||||||||||
| Vehicle Technologies | Abbreviation | Most Likely | Most Likely | Most Likely | Relative To | ||||||||||||||
| NHTSA Technologies | |||||||||||||||||||
| Without Engine Downsizing | |||||||||||||||||||
| 0 - 2.5% Mass Reduction (Design Optimization) | MR2.5 | 0 - 22 | 0 - 28 | 0 - 39 | Baseline | ||||||||||||||
| 2.5 - 5% Mass Reduction | 0 - 66 | 0 - 85 | 0 - 112 | Previous MR | |||||||||||||||
| 0 - 5% Mass Reduction (Material Substitution) | MR5 | 0 - 88 | 0 - 113 | 0 - 151 | Baseline | ||||||||||||||
| With Engine Downsizing (Same Architecture)b | |||||||||||||||||||
| 5 - 10% Mass Reduction | 151 - 315 | 194 - 405 | 264 - 558 | Previous MR | |||||||||||||||
| 0 - 10% Mass Reduction (HSLA Steel and Aluminum Closures) | MR10 | 151 - 403 | 194 - 518 | 264 - 710 | Baseline | ||||||||||||||
| 10 - 15% Mass Reduction (Aluminum Body) | 431 - 730 | 554 - 938 | 751 - 1,279 | Baseline | |||||||||||||||
| 0 - 15% Mass Reduction (Aluminum Body) | MR15 | 431 - 730 | 554 - 938 | 751 - 1,279 | Baseline | ||||||||||||||
| 15 - 20% Mass Reduction | 486 - 600 | 626 - 772 | 866 - 1,064 | Previous MR | |||||||||||||||
| 0 - 20% Mass Reduction (Aluminum Body, Magnesium, Composites) | MR20 | 917 - 1,330 | 1,179 - 1,710 | 1,617 - 2,343 | Baseline | ||||||||||||||
| 20 - 25% Mass Reduction | 1,026 - 1,260 | 1,319 - 1,620 | 1,807 - 1,947 | Previous MR | |||||||||||||||
| 0 - 25% Mass Reduction (Carbon Fiber Composite Body) | MR25 | 1,943 - 2,590 | 2,498 - 3,330 | 3,424 - 4,290 | Baseline | ||||||||||||||
| Mass Reduction Cost ($ per lb.) | |||||||||||||||||||
| 0 - 2.5% Mass Reduction | MR2.5 | 0.00 - 0 .25 | 0.00 - 0 .25 | 0.00 - 0.28 | Baseline | ||||||||||||||
| 0 - 5% Mass Reduction | MR5 | 0.00 - 0.49 | 0.00 - 0.49 | 0.00 - 0.55 | Baseline | ||||||||||||||
| 0 - 10% Mass Reduction | MR10 | 0.43 - 1.15 | 0.43 - 1.15 | 0.48 - 1.29 | Baseline | ||||||||||||||
| 0 - 15% Mass Reduction | MR15 | 0.82 - 1.39 | 0.82 - 1.39 | 0.91 - 1.55 | Baseline | ||||||||||||||
| 0 - 20% Mass Reduction | MR20 | 1.31 - 1.90 | 1.31 - 1.90 | 1.47 - 2.13 | Baseline | ||||||||||||||
| 0 - 25% Mass Reduction | MR25 | 2.22 - 2.96 | 2.22 - 2.96 | 2.49 - 3.12 | Baseline | ||||||||||||||
| Low Rolling Resistance Tires - Level 1 (10% reduction in rolling resistance) | ROLL1 | 5 | 5 | 5 | Baseline | ||||||||||||||
| Low Rolling Resistance Tires - Level 2 (20% reduction in rolling resistance) | ROLL2 | 31 | 31 | 31 | Previous Tech | ||||||||||||||
| Low Drag Brakes | LDB | 59 | 59 | 59 | Baseline | ||||||||||||||
| Aerodynamic Drag Reduction - Level 1 | AERO1 | 33 | 33 | 33 | Baseline | ||||||||||||||
| Aerodynamic Drag Reduction - Level 2 | AERO2 | 100 | 100 | 100 | Previous Tech | ||||||||||||||
*Costs with reduced number of cylinders, adjusted for previously added technologies – see Appendix T for the derivation of the turbocharged, downsized engine costs.
a With TWC aftertreatment. Costs will increase with lean NOx aftertreatment.
b Includes mass decompounding: 40% for cars, 25% for trucks.
NOTE: Midsize car: 3,500 lbs, large car: 4,500 lbs, large light truck: 5,500 lbs.
This page intentionally left blank.


