
carcinogenic potency of an agent at low doses. The statistical upper confidence limit on q1, denoted q1*, can be determined by the methods of Crump (1984), which are sometimes referred to as the linearized multistage (LMS) model. Although q1 is sometimes zero, q1* is always positive, and the upper limit on the extra risk of cancer (above the spontaneous incidence) associated with a small dose, d, has approximately the linear form q1* d.
Krewski et al. (1991) proposed a ''model-free" estimate (MFX) of low dose carcinogenic potency based on a series of secant approximations to the slope of the dose-response curve between points in the low dose region and controls. Because their derivations are similar, MFX and q1* generally give similar estimates of low dose carcinogenic potency (Krewski et al., 1991).
CORRELATIONS
Several authors have reported a high correlation between the TD50 (or carcinogenic potency) and the HDT within various selected subsets of data in the CPDB (Bernstein et al., 1985; Crouch et al., 1987; Rieth and Starr, 1989a,b). In most cases, the HDT was also the EMTD; that implies a high correlation between high dose carcinogenic potency and potency in causing other chronic toxic effects. Zeise et al. (1984, 1985, 1986) and Metzger et al. (1989) have reported high correlations between the TD50 and the LD50 (i.e., between carcinogenic potency and acute toxicity).
The committee decided to review those correlations in an effort to investigate the relationship between toxicity and carcinogenic potency in MTD bioassays. Krewski et al. (Appendix F) performed the review and extended the reported correlations in several ways on the basis of data from their subset of 191 chemicals in the CPDB. They included in their analysis all studies in the CPDB that met the following criteria:
-
Rodents were used.
-
Chemicals were given orally.
-
Results specified organ or tumor type, not total tumor-bearing animals.
-
Exposure to the test chemical did not notably reduce survival of the test animals in comparison with unexposed controls.
-
The dose-response trend was significant at p < 0.01.
-
Authors stated that results were positive for carcinogenicity.
-
The study included at least two doses and controls.
In their analysis, Krewski et al. omitted data at the highest dose if the dose-response curve turned downward and used the smallest TD50 if data were available from multiple sites or experiments. Krewski et al. estimated the TD50 with three models of the dose-response relationship: single-stage, multistage, and Weibull models. The correlation coefficients between estimates of the TD50 and HDT were 0.924, 0.952, and 0.821, respectively. Krewski et al. attributed the differences in correlation coefficients to the fact that the multistage model provides for upward curvature of the dose-response relationship, whereas the Weibull model provides for both upward and downward curvature and so is likely to permit a greater range of TD50 values. Krewski et al. also calculated correlations between the HDT and estimates of low dose carcinogenic potency; they reported a correlation coefficient of -0.941 between the HDT and q1* and a correlation coefficient of -0.960 between the HDT and the estimate of low dose potency based on the MFX. Finally, Krewski et al. explored how estimates of low dose and high dose carcinogenic potency could be predicted from the HDT on the basis of the observed correlations. Using the method of Gaylor (1989), they showed that a preliminary estimate of the upper-bound dose corresponding to the 95% upper confidence limit for an increased cancer risk of 1 × 10⁻⁶ based on the LMS model could be made in the absence of a standard bioassay by dividing the MTD by 380,000.
The main issue that has arisen in interpreting the observed correlations, both in previous publications (Bernstein et al., 1985; Crouch et al., 1987; and Rieth and Starr, 1989a,b) and in the MTD workshop discussions, is the extent to which the correlations are tautologous, that is, determined by features of the experimental designs and by the ways in which the experimental data are selected and analyzed, rather than by the underlying biologic mechanisms.
Figure 2-1 shows the TD50s calculated by applying the one-stage dose-response model to data in the CPDB (Krewski et al., Appendix F) plotted against MTDs on a log-log scale. (The horizontal axis is the
highest dose tested, which is assumed to correspond to an estimate of the MTD.) As Figure 2-1 indicates, the data on the 191 chemicals are tightly grouped about the best-fitting linear regression line; none of the TD50s appears to differ from that predicted by the regression line by more than a factor of about 10.
Bernstein et al. (1985) point out that this relationship can be explained
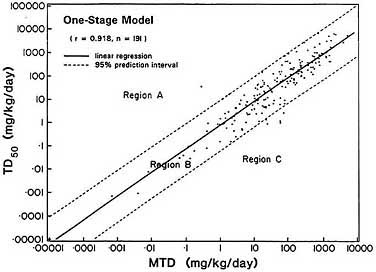
FIGURE 2-1 Association between carcinogenic potency and maximum tolerated dose. Relationship between the highest dose tested for 191 chemicals that tested positive for carcinogenicity in chronic rodent bioassays and their TD50, an inverse measure of carcinogenic potency defined dose rate that halves likelihood of remaining tumor-free. Region A corresponds to chemicals of low carcinogenic potency (high TD50) relative to MTD; Region C corresponds to chemicals of high carcinogenic potency (low TD50) relative to MTD. Most chemicals fall into Region B, their toxicities and carcinogenic potencies are correlated.
on the basis that, given the MTD, the TD50 is constrained to lie between two bounds. The lower bound is determined by the number of animals tested at the MTD, the spontaneous tumor rate, and the level of statistical significance required to label a chemical as a carcinogen. For example, if there is a 10% spontaneous rate and 50 animals are tested at the MTD, at least 10 animals must respond at the MTD if an effect is to be declared statistically significant at the 5% probability level. That minimum corresponds to a maximum TD50 value of 5.9 times the MTD. The upper bound is determined by the fact that it is very rare for 100% of the animals tested at the MTD to get tumors. If 49 of 50 animals get cancer at the MTD, compared with five of 50 control animals, the TD50 is estimated as 0.18 MTD. Thus, within those two bounds, the TD50 differs from the MTD only by, at most, a factor of about 6—i.e., 5.9 or 5.6 (1/0.18). Bernstein et al. (1985) showed that similar bounds apply to more general experimental designs involving two or three dosed groups. Assuming that the TD50 is uniformly distributed within those limits, Krewski et al. (Appendix F) showed that the theoretical correlation between log MTD and log TD50 would be 0.965, which is very close to the 0.918 obtained by Krewski et al. from the data shown in Figure 2-1. Thus, given the bounds established by Bernstein et al. (1985), a high correlation between MTD and TD 50 is inevitable.
The committee's discussion of the possible interpretations and implications of those findings centered around the three regions shown in Figure 2-1. Region B (the region between the two broken lines) corresponds to the region determined by the bounds introduced by Bernstein et al. (1985); Region A corresponds to chemicals of low carcinogenic potency (high TD50) relative to their MTD; and Region C corresponds to chemicals of high carcinogenic potency (low TD50) relative to their MTD. The salient feature of this plot is that most of the chemicals in the analysis fall in Region B, whereas Regions A and C are virtually empty. Because the existence of a correlation is implied by the absence of chemicals in Regions A and C, the committee undertook to understand more fully why Regions A and C are nearly empty.
Krewski et al. (Appendix F) restricted their analysis to all chemicals in the CPDB that were clearly carcinogenic. Chemicals that were not identified as carcinogenic in any animal bioassay might have included both true noncarcinogens and chemicals with a carcinogenic potency that was too low to cause statistically significant increases in tumors in ani-
mals exposed at the MTD for a lifetime. Although the latter chemicals cannot be positioned with precision in Figure 2-1, it is clear from the definition of the three regions that they are Region A chemicals; if they could be positioned in Region A, the observed correlations would probably be reduced. Thus, the committee concludes that the correlation between the MTD and the TD50 might apply not to all chemicals, but only to those with carcinogenic potency high enough to cause statistically significant increases in tumors in animals exposed at the MTD for a lifetime. Therefore, the observed correlation is partially tautologous, to the extent that it might result partially from our inability to position Region A chemicals in graphs like Figure 2-1.
However, the absence of chemicals from Region C is not obviously tautologous. If a chemical tested in a standard long-term bioassay is a true Region C chemical, it should be identifiable as such. If a chemical caused cancer in all animals tested at the MTD, it still might not cause cancer in all animals exposed at lower doses or for shorter periods, in which case it could be positioned in Figure 2-1. If a chemical caused tumors in all the dosed animals in a bioassay, it could be identified as belonging in Region C, although it would not be possible to position it at a specific location in Region C. However, it is possible that chemicals belonging to Region C have been systematically excluded from the CPDB or, if present in the CPDB, excluded from the analyses conducted by Krewski et al. Although the inclusion criteria used by Krewski et al. (e.g., inclusion only of studies that used the oral route) resulted in the inclusion of only a fraction of the chemicals in the CPDB, it does not appear that there would be a bias toward excluding chemicals with low TD 50s relative to their HDTs. But the inclusion criteria for the CPDB could have resulted in the omission of some Region C chemicals. For instance, the exclusion of studies that lasted for less than half the normal lifespan of the animals could have resulted in excluding studies that were terminated when tumors were detected very early. And some chemicals might have been identified as potent carcinogens long ago and consequently not tested in a bioassay that satisfied standards used by Gold et al. (1984) as criteria for inclusion; e.g., some early bioassays might not have used control groups or might not have reported results in terms of the numbers of animals with tumors.
To investigate further the extent to which Region C carcinogens exist, the committee compiled a list of 18 chemicals (Table 2-1) that it judged as potential Region C carcinogens and conducted a detailed study of
TABLE 2-1 Chemicals Considered as Potential Region C Carcinogens
|
2-acetylaminofluorenea |
Dimethyl sulfatec |
|
Acrylonitrilea |
Ethylene dibromidea |
|
Benzidinea |
Ethylene oxidea |
|
Benzo[a]pyreneb |
Ethylnitrosoureaa |
|
1,3-Butadieneb |
Methyl bromide |
|
Carbon tetrachloridea |
4,4'-Methylene-Bis(2-chloroaniline) (MOCA)a |
|
C.I. Direct Black 38a |
|
|
C.I. Direct Blue 6a |
Plutoniumc |
|
C.I. Direct Brown 95a |
Vinyl chloridec |
|
Dibenz[a,h]anthracenec |
|
|
aReported in CPDB. bAdditional data obtained. cNot analyzed. |
|
them. The detailed results of the study are included as Appendix G to this report. Twelve of the 18 chemicals were already represented in the CPDB. Suitable quantitative data were found on benzo[a]pyrene and 1,3-butadiene that permitted estimation of TD50s for them, and an additional ingestion study of vinyl chloride was identified that was not included in the CPDB; data on those three chemicals were provided to Krewski et al., who calculated TD50s with the same procedure as used in the workshop paper. TD50s could not be estimated for dibenz[a,h]anthracene, dimethyl sulfate, and methyl bromide, because no suitable quantitative data were located. Plutonium was not included in the analysis, because the dose measure used for it was not commensurate with that used for chemical carcinogens. Thus, of the 18 chemicals identified by the committee as potential Region C carcinogens, 14 were investigated. Five of these—the three benzidine dyes (C.I. direct black 38, C.I. direct blue 6, and C.I. direct brown 95), carbon tetrachloride, and 1,3-butadiene—belong in Region C (Figure 2-2). However, none of the TD50s for these five chemicals was more than a factor of 10 or so smaller than the bound that divides Region C from Region B. Thus, the committee did not uncover any chemicals that appear to be positioned substantially far out into Region C.
The methods used by Krewski et al. (Appendix F) to estimate TD50s
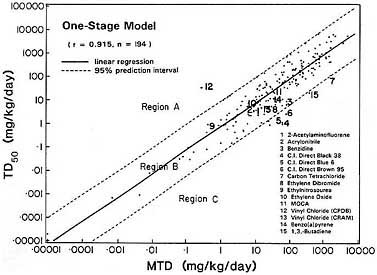
FIGURE 2 Association between carcinogenic potency and maximum tolerated dose. This graph is essentially the same as Figure 1 with 14 potential Region C chemicals explicitly identified. Included are data on three chemicals that were examined by the committee but were not present in the CPDB.
are similar to those used in the CPDB. As in the CPDB, the TD50s in Figures 2-1 and 2-2 are based on an essentially linear one-stage model applied to the crude proportions of animals that developed tumors during the course of the study. For studies that lasted less than the standard lifespan of the test species, the TD50 is adjusted to a standard rodent lifetime by multiplying it by a correction factor, f2, where f is the ratio of the length of the experiment to the normal lifespan of the test species. That correction is based on the assumption that, if experimental animals had lived longer, a greater percentage of them would have developed
tumors as a result of exposure to the test agent, or agent-related tumors would have been discovered at lower doses.
The studies of the three benzidine dyes involved rats and lasted only 3-months, so a correction factor of (3/24)2 = 0.016 was applied. Although the criteria for inclusion of rodent experiments in the CPDB stipulate that they lasted for a minimum of 12-months, all NTP studies are included in the CPDB, regardless of duration. The three experiments with the benzidine dyes were actually subchronic toxicity studies in which neoplastic lesions were observed. For ethylene dibromide, most of the rats died of tumors within 6- months, and a correction factor of (6/24)2 = 0.06 was used. The carbon tetrachloride study lasted 84 weeks and involved a correction factor of (84/104)2 = 0.65. Because the bioassays of each of the chemicals lasted less than the lifespan, the exact positioning of the five chemicals in Region C is uncertain (although more nearly certain for carbon tetrachloride).
The correction used in the CPDB is ad hoc and does not have a strong experimental or theoretical basis. The Environmental Protection Agency typically uses a correction factor of f3 (Anderson et al., 1983), which would make estimated TD50s even smaller. Portier et al. (1980) found that a factor of f3 was consistent with many bioassays conducted by the NTP. Doll (1971) observed that a factor of f2 to f6 is needed to describe the age-incidence curves for human cancer. It is not clear what is an appropriate correction factor, so TD50s the basis of studies lasting less than the standard lifespan of the test species are more uncertain than those estimated on the basis of whole-lifespan studies. The effect of this adjustment factor on the correlation between the TD50 and the MTD warrants investigation, although ultimate resolution of this uncertainty would require retesting of these chemicals at lower doses for a full lifespan.
In summary, the committee's informal study suggested that documented Region C carcinogens are rare. The best candidates for Region C carcinogens are five chemicals that induce cancer in rodents after short exposures. No bioassay lasting the full lifespan of the test species has been conducted for any of the five chemicals. Consequently, estimates of the TD50s for the chemicals are uncertain, and their designation as Region C carcinogens is also uncertain.
In interpreting those results, we must keep two facts in mind. First, the TD50s are uncertain for chemicals that have not been tested in life-
time bioassays; it is theoretically possible that these chemicals could be positioned substantially further out into Region C than is indicated by Figure 2-2. Second, the analyses assume that the HDT in each study is a reasonable approximation of the MTD; this might not be the case for all studies in the CPDB, particularly some of the older studies.
On the basis of the evidence discussed above, the committee concludes that the chemicals tested to date in lifetime bioassays have been found generally not to have TD50s that are far less than their MTDs. The Bernstein lower bound of 0.18 MTD for the TD50 will not be universally applicable, however, because it is based on the use of an essentially linear one-hit model and the assumption that not all of the exposed animals will develop tumors. The lower bound also might not apply to TD50s adjusted for intercurrent mortality with the method described by Sawyer et al. (1984), as is done in the CPDB whenever individual animal survival times are available. Krewski et al. (Appendix F) provide bounds on the TD50 relative to the MTD by using a Weibull dose-response model, which allows for curvature in the dose-response relationship. Although the bounds are wider, the correlation between the TD50 and MTD remains high, regardless of the degree of curvature in the dose-response curve (Kodell et al., 1990).
The committee further concludes that comparisons between TD50s and MTDs indicate a relationship between measures of general toxicity (e.g., the MTD) and carcinogenic potency that can be expressed as follows: Animal carcinogens generally have a carcinogenic potency sufficient to cause just-detectable increases in cancer in standard bioassays at doses near the MTD.
The correlations considered here demonstrate that the carcinogenic potencies of materials found to be carcinogens are inversely related to MTDs; that is, if the MTD is high, the carcinogenic potency tends to be low. However, the MTD itself does not predict the likelihood that a material will be a carcinogen. The underlying cause of the observed relationship is not clear. General toxicity and cancer induction have a number of steps in common. A material must be absorbed, possibly metabolized, and transported to the site of action. Those common elements might be partially responsible for the observed relationship.
In addition, cell toxicity might result in increased cell division, which in turn could result in the permanent incorporation of spontaneous DNA damage that will eventually lead to cancer. The observed relationship


