Appendix G
Informal Search for ''Supercarcinogens"
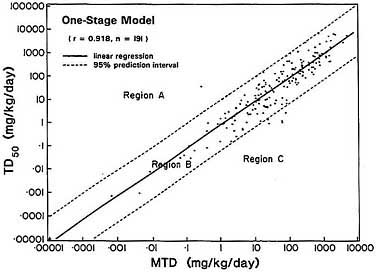
As discussed in the text of the report, the graph of TD50 versus MDT can be divided empirically into three regions (Figure 1). By observation, most carcinogens are in a narrow band (Region B); few are above (Region A) or below (Region C) this band. The absence of carcinogens from Region A might be partly or entirely artifactual. Any carcinogen whose biologic properties would place it in Region A would have such low potency (such a high TD50) that it would give a very weak response even if tested at the MTD; hence, it would not be recognized as carcinogenic and would not be included in the CPDB. Thus, no conclusions can be drawn from the apparent emptiness of Region A.
The absence of carcinogens from Region C, however, is not obviously artifactual. The argument put forward by Rieth and Starr (1989b) that any carcinogens that belong properly in Region C would yield 100% tumor incidence in a conventional bioassay, so a finite TD50 could not be calculated, is incorrect. For some chemicals that yield 100% tumor incidence, the CPDB includes a 99% upper confidence limit on the TD50 (Gold et al., 1986a); for others, tumor incidence less than 100% can be observed in bioassays conducted at lower doses or for periods shorter than a lifetime. Thus, if some chemicals truly belong in Region C, they should be detectable, and it should be possible to derive numerical estimates of potency for at least some of them.
Nevertheless, the committee identified several types of bias that might